

Analyzing Trends, Spotting Opportunities, and Making Informed Trading Decisions
Mastering Bank Nifty Option Chain Data in NSE India
The Bank Nifty is a popular index in the Indian stock market that represents the performance of the banking sector. As an options trader, understanding and analyzing the BankNifty option chain data in NSE is essential for making informed trading decisions.
What is an Option Chain
An options chain is a table that displays all available options contracts for a particular security, such as the Bank Nifty index.
Understanding the BankNifty Option Chain
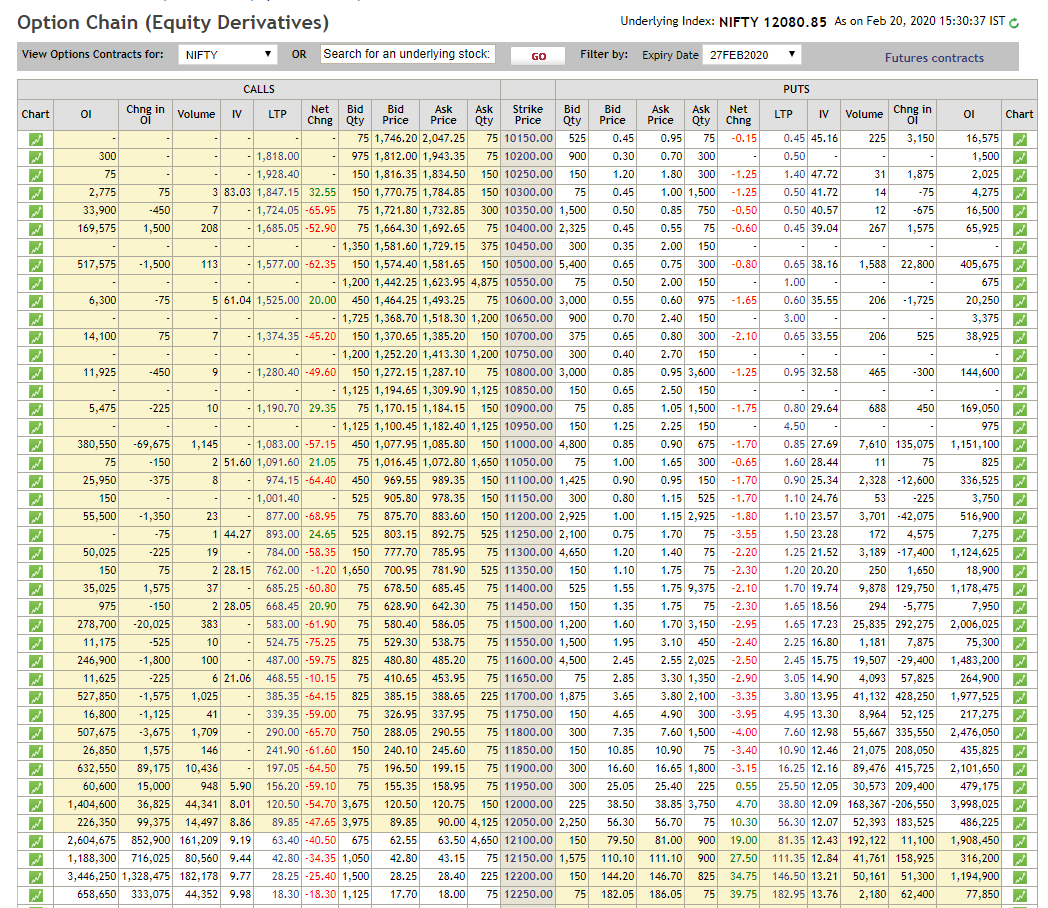
The Bank Nifty option chain gives you key data about options contracts. You can see strike prices, premiums, open interest, volume, and implied volatility for both call and put options. By analyzing this data, you can gauge market sentiment, find support and resistance levels, and start your options trading journey with more confidence.
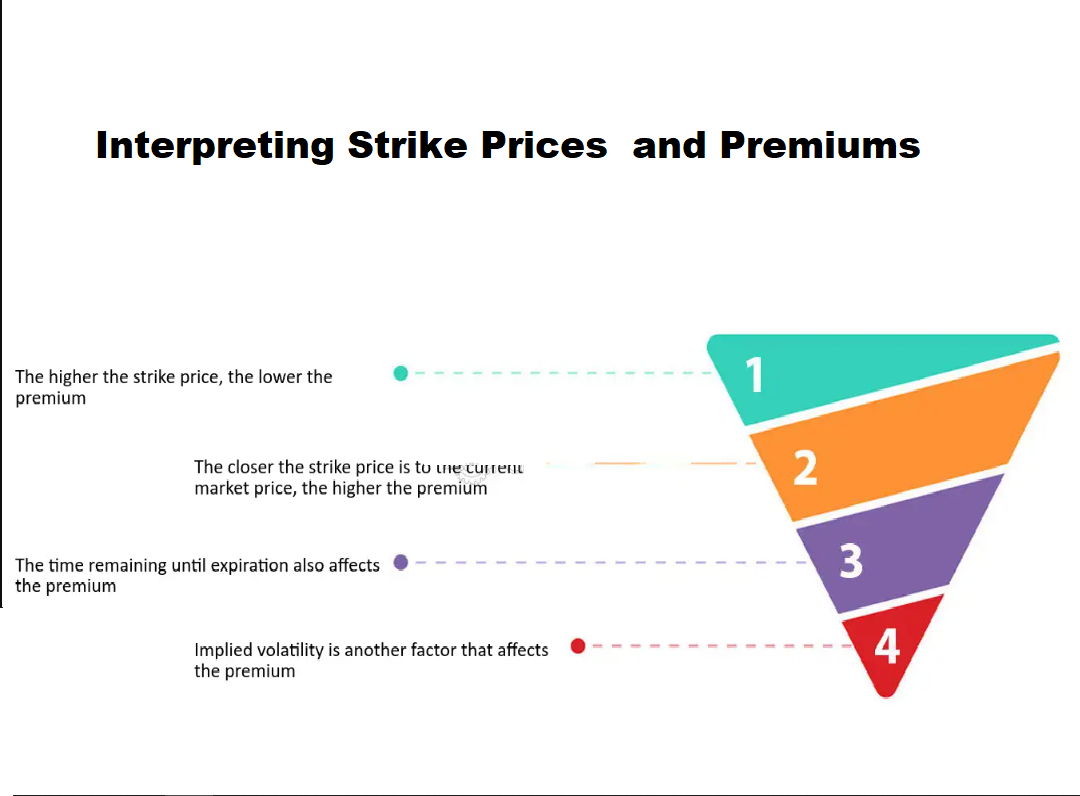
Interpreting Strike Prices and Premiums
Strike prices are significant levels at which an option can be exercised. In the BankNifty option chain, strike prices are listed in ascending order, with “At-the-Money” (ATM) options situated near the current market price of the index.
Premiums represent the cost of purchasing an option contract. Higher premiums imply higher market expectations for price movements, while lower premiums indicate relatively lower expectations. Analyzing strike prices and premiums can help traders assess market sentiment, identifying key market levels.

Analyzing Open Interest and Volume
Open interest refers to the total number of outstanding option contracts in the market. It signifies the liquidity and popularity of a specific strike price. Higher open interest suggests increased market participation and can indicate strong support or resistance levels.
Volume, on the other hand, represents the number of contracts traded during a specific time period. Analyzing volume alongside open interest helps traders understand market activity and gauge the strength of price movements. Higher volume often accompanies significant price changes and can provide insights into potential trend reversals or continuations.
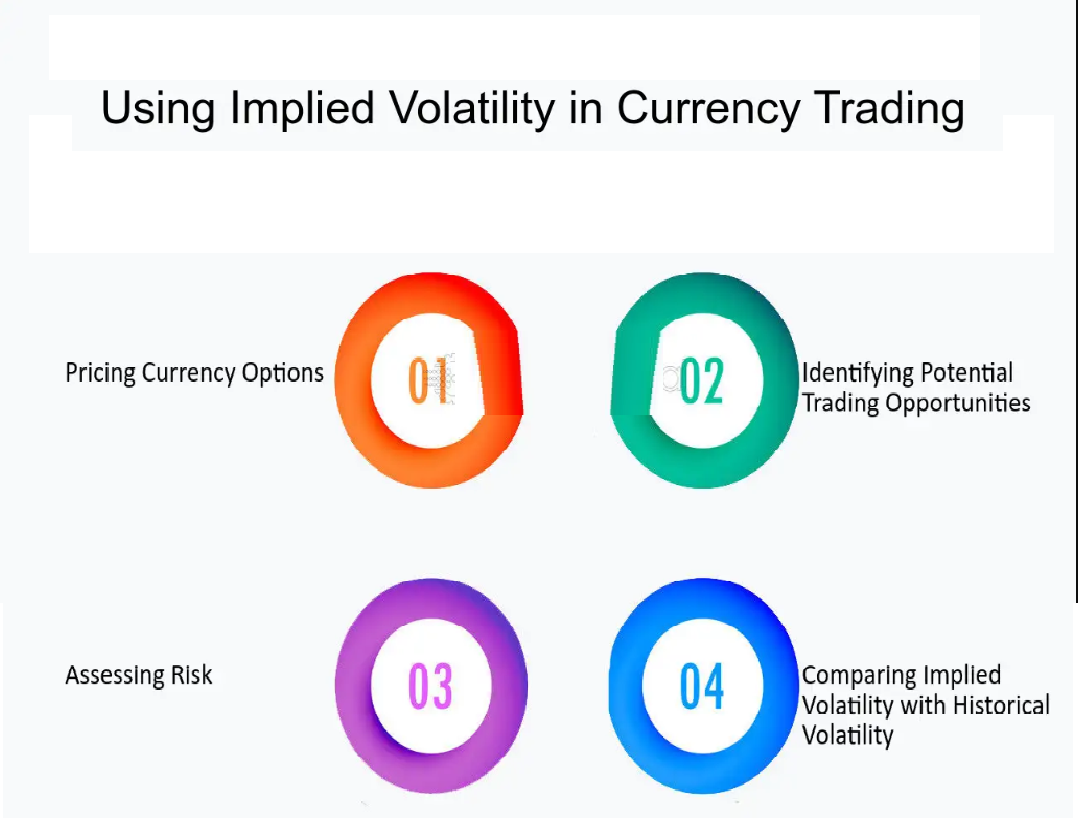
Implied Volatility: Assessing Market Expectations
Implied volatility (IV) is a crucial metric derived from option prices, reflecting market expectations of future price volatility. High IV indicates anticipated larger price swings, while low IV suggests expectations of relatively stable price movements.
Analyzing implied volatility in the BankNifty option chain helps traders assess market sentiment and potential risks. High IV may present opportunities for option sellers seeking to benefit from premium decay, while low IV might attract option buyers looking for cheaper contracts.

Spotting Trends with Option Chain Data
The Bank Nifty option chain helps you identify trends in Bank Nifty options and analyze market movements. By watching changes in open interest, volume, premiums, and implied volatility across different strike prices, you can spot emerging trends and price moves.
Rising open interest at certain strike prices shows growing market interest. It can hint at bigger price moves ahead. Rising premiums and implied volatility in one direction also signal what the market expects next.
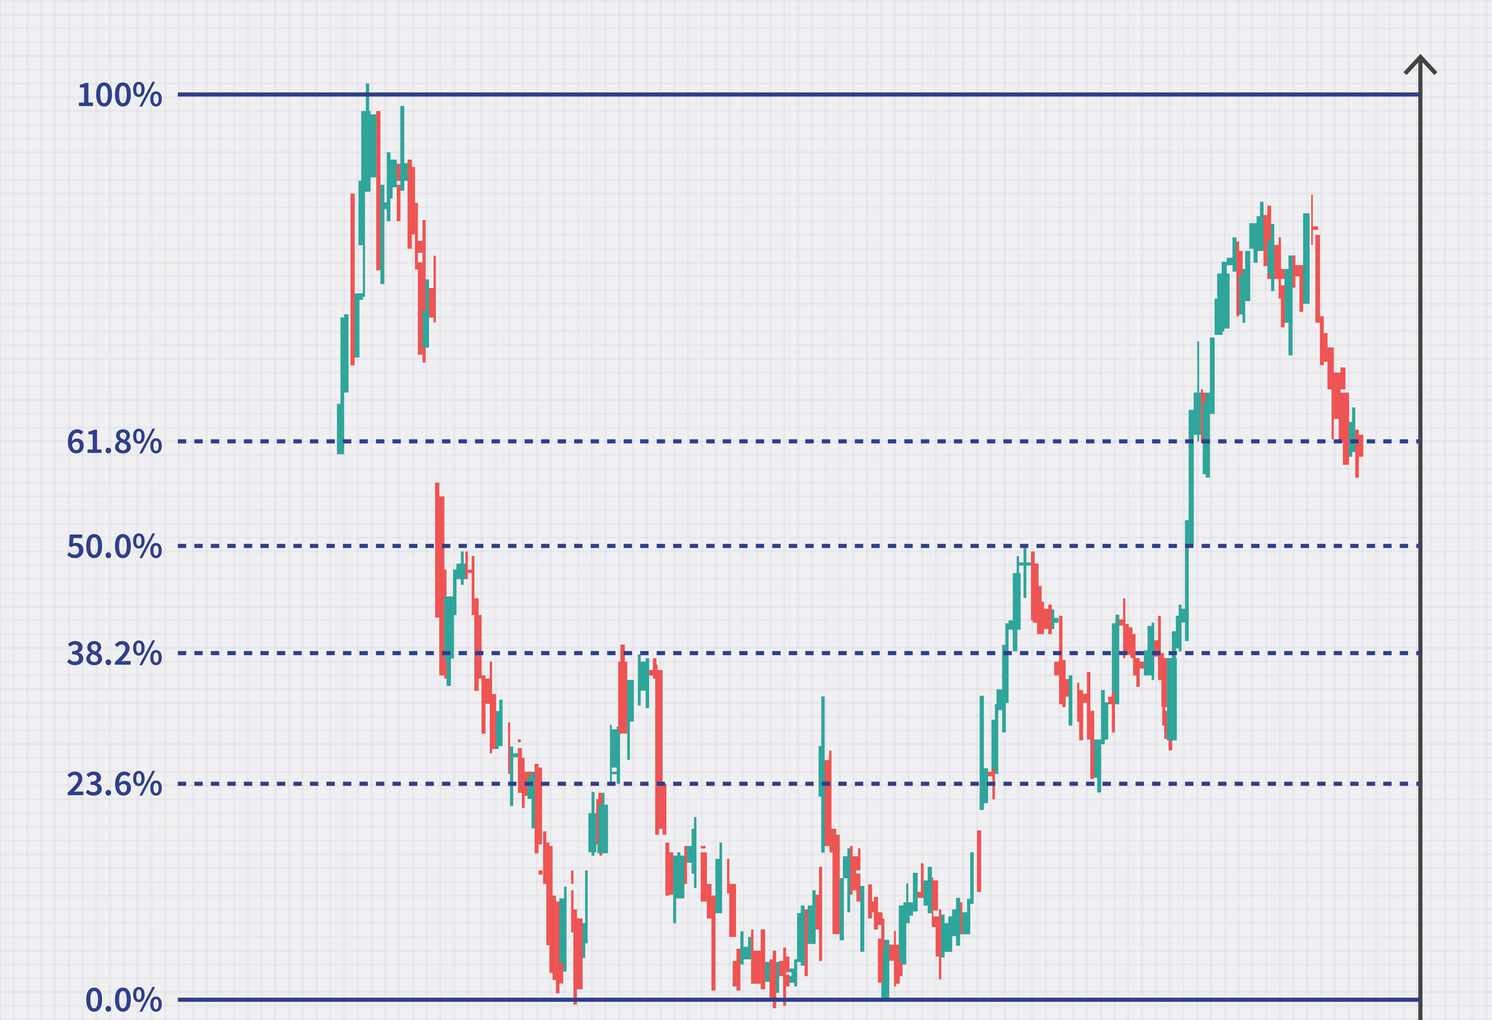
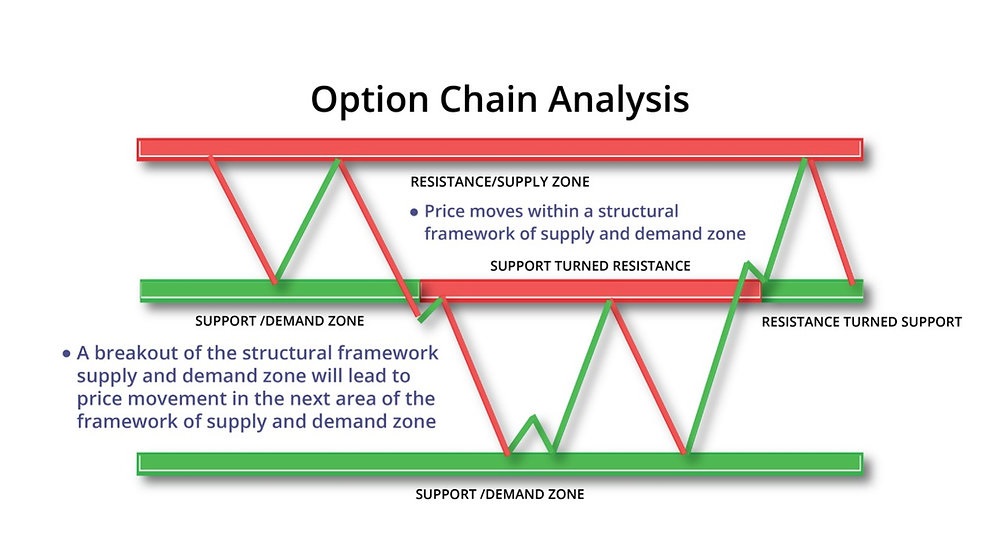
Support and Resistance Levels
Support and resistance levels play a key role in using technical analysis in Bank Nifty options trading and making sound decisions. The option chain can reveal these levels by showing strike prices with high open interest or heavy volume.
Strike prices with high open interest act as support or resistance levels. That is because many traders have a stake in those options. You can use these levels to plan your entry and exit points or build strategies around breakouts.
Options Strategies based on Option Chain Analysis
Option chain analysis enables traders to develop strategies based on their findings. Here are a few popular strategies used by traders in the BankNifty option chain:
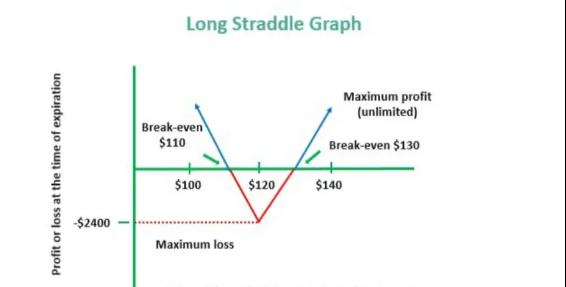
Long Straddle
A long straddle involves buying both a call and a put option with the same strike price and expiration date. Traders employ intraday option trading techniques when they anticipate a significant price movement but are unsure about its direction. By analyzing the option chain, traders can identify strike prices with relatively low premiums to reduce their cost of entry for this strategy.

Short Straddle
In contrast to the long straddle, a short straddle involves selling both a call and a put option with the same strike price and expiration date. Traders adopt this strategy when they expect minimal price volatility. Analyzing high premiums and implied volatility in the option chain can help identify suitable strike prices for implementing this strategy.
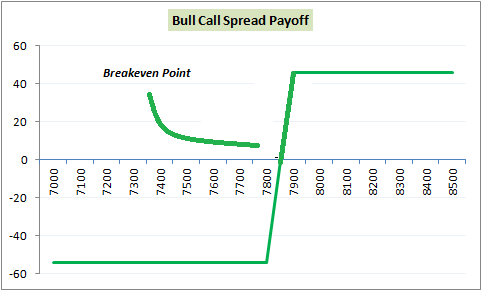
Bullish/Bearish Spreads
Popular option trading strategies involve simultaneously buying and selling multiple options contracts to take advantage of price differentials between them. Bullish spreads are implemented when traders expect an upward price movement, while bearish spreads are utilized for downward price expectations.
By analyzing premiums, open interest, and volume in the option chain, you can find the right strike prices for your spread strategies.
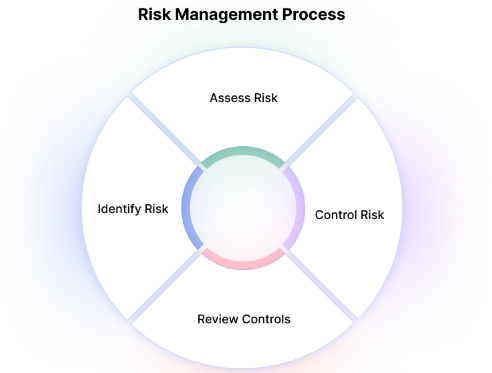
Risk Management with Option Chain Analysis
Risk management is paramount in options trading. Analyzing the BankNifty option chain can help traders assess potential risks associated with their positions.
By examining premiums and implied volatility for different strike prices, traders can determine the risk-reward ratio of particular options contracts. Additionally, monitoring changes in open interest and volume can provide insights into potential liquidity risks or market manipulation.
Mastering the Bank Nifty option chain helps you analyze trends, spot opportunities, and make better trading decisions. By understanding strike prices, premiums, open interest, volume, and implied volatility, you can trade with more confidence in the Indian stock market.
Remember, the option chain is just one tool. For best results, pair it with technical analysis, research, and smart risk management.
Finding the Bank Nifty options chain
- Visit a financial website or an online trading platform that provides access to options data.
- Search for “Bank Nifty options chain” or navigate to the options section for the Bank Nifty index.
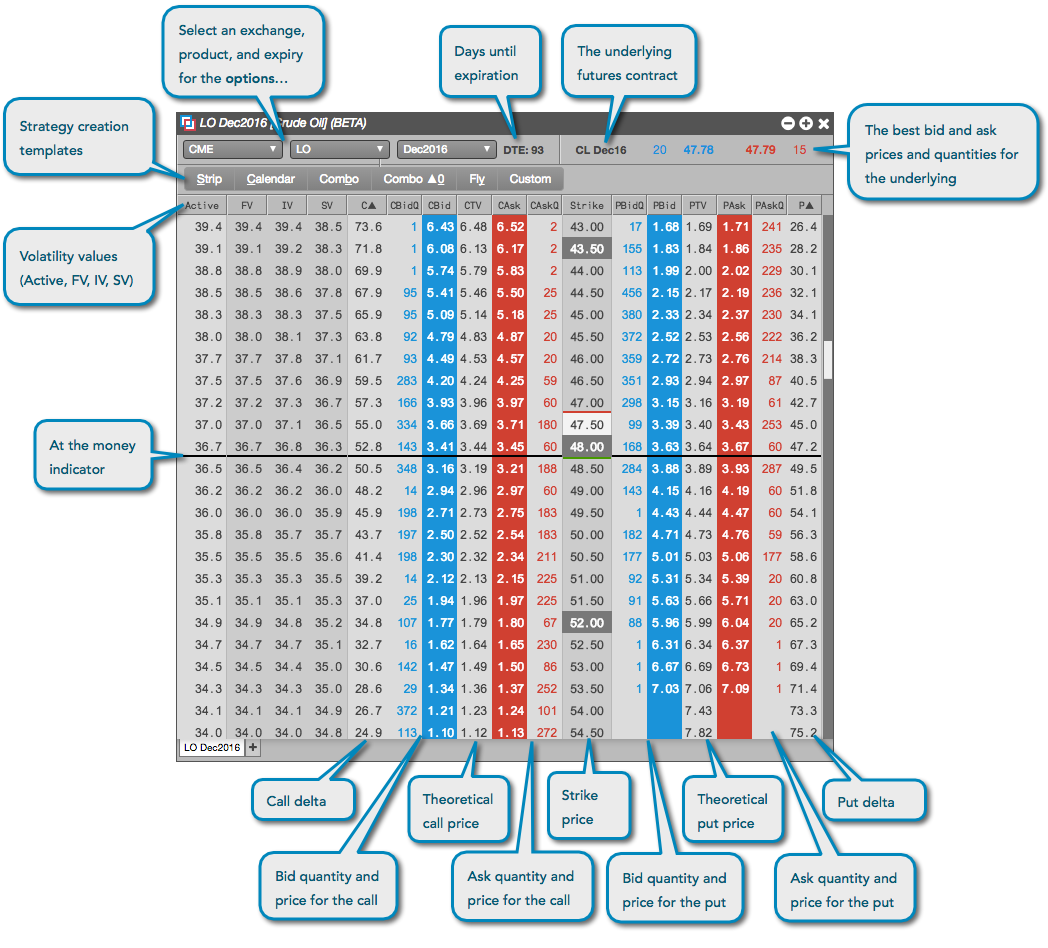
Understanding the columns in the options chain
- Strike Price: The price at which the option can be exercised.
- Call/Put: Indicates whether it is a call option (buying the underlying asset) or put option (selling the underlying asset).
- Last Price: The most recent price at which the option was traded.
- Change: The change in the option’s price compared to the previous trading day.
- Open Interest: The total number of open contracts for that option.
- Volume: The total number of contracts traded during the current trading day.
- Bid/Ask: The bid price is the maximum price a buyer is willing to pay, while the ask price is the minimum price a seller is willing to accept.
Analyzing the Bank Nifty options chain
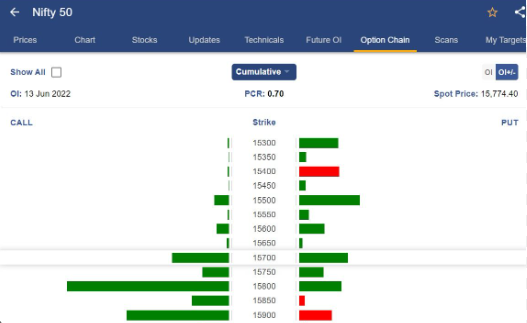
- Look for the highest open interest strike price for calls and puts. This indicates the level where most market participants expect the Bank Nifty to reach or remain below (for calls) or above (for puts) by expiration.
- Check the volume and open interest to identify highly liquid contracts that have active trading activity.
- Monitor the bid/ask spread to assess liquidity and transaction costs.
- Observe changes in the last price and open interest to identify trends and potential shifts in market sentiment.
Here is a step-by-step tutorial on how to analyze the Banknifty Options Chain:
- Open a browser and go to a financial site or trading platform that shows the Bank Nifty option chain. Popular options include NSE (National Stock Exchange) and BSE (Bombay Stock Exchange).
- Find the section for derivatives or options trading. It is often under “Markets” or “Trading.”
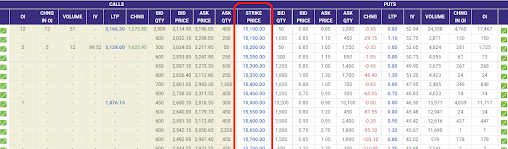
- Look for the Bank Nifty option chain. It is usually shown in a table with rows and columns of data.
- The first column shows the strike price. This is the set price at which you can buy or sell the Bank Nifty index.
- The next column shows call options for each strike price. A call gives you the right to buy the index at that price within a set time.
- The third column shows put options for each strike price. A put gives you the right to sell the index at that price within a set time.
- Other columns show the current Bank Nifty price, open interest (total open contracts), volume (contracts traded today), and price changes.
- Study the data to understand market sentiment and find trading opportunities. Look for patterns, big changes in open interest or volume, and unusual activity.
- Watch option premiums – the price of each contract. Higher premiums mean more demand or bigger expected price moves.
- Use option strategies based on your analysis. You might buy or sell calls or puts, or use strategies like straddles, strangles, or spreads.
- Keep in mind that analyzing the option chain takes practice. Learn about key concepts like delta, gamma, theta, and vega, plus risk management.
- Always do your own research and talk to a financial advisor before making trading decisions based on option chain analysis.
Using the Bank Nifty options chain for trading

- Determine your trading strategy, whether it’s bullish, bearish, or neutral.
- Based on your strategy, identify strike prices that align with your outlook.
- Evaluate the premium (option price) of your selected options and assess their risk-reward potential.
- Consider setting stop-loss orders to manage risk and protect against adverse market moves.
Analyzing the Bank Nifty option chain requires a good understanding of options trading and market dynamics. It is always a good idea to consult with a SEBI Registered Investment Advisor or do your own research before making any trading decisions.

Free Registration for Stock Market Tips ( Advisory Services)


As per the SEBI rules, we will provide our Services only to those clients who have Complete Risk Profile. Fill This Registration Form and
Contact us on
- Whatsapp @ +91 95999 69624
- Call Us @ +91 9650 890 321
for further process.
Risk Profiling is COMPULSORY
What Is the Bank Nifty Option Chain and How Do You Read It?
The Bank Nifty option chain is a data table published by the National Stock Exchange (NSE) of India that displays all available call and put option contracts for the Bank Nifty index, organized by strike price. Each row in the chain shows the strike price, the last traded price, change, bid and ask prices, open interest, and volume for both call and put options side by side. Traders use this data to assess market sentiment, identify support and resistance levels, and build options trading strategies for intraday or positional trades.
What data does the Bank Nifty option chain show?
The option chain displays strike prices in ascending order with corresponding call option data on one side and put option data on the other. Key columns include strike price, last price, change, bid price, ask price, open interest, and volume. The at-the-money (ATM) strike is the strike price closest to the current Bank Nifty index value.
How do you identify support and resistance using the option chain?
Strike prices with the highest open interest in call options often act as resistance levels, while strike prices with the highest open interest in put options often act as support levels. High open interest concentration indicates where market participants have placed significant bets, making those levels harder to break through.
What is the difference between open interest and volume in the option chain?
Open interest represents the total number of outstanding option contracts that have not been closed or exercised. Volume represents the number of contracts traded during a single trading session. Rising open interest alongside rising volume confirms a strong trend, while falling open interest may signal that the trend is losing momentum.
How does implied volatility appear in the Bank Nifty option chain?
Implied volatility (IV) is not always shown as a direct column in the basic option chain but can be derived from the premium, strike price, time to expiry, and the risk-free rate. Many trading platforms display IV as an additional column or in a separate volatility analysis section. Higher IV indicates expectations of larger price swings in the Bank Nifty index.
What is the best strategy for reading the Bank Nifty option chain for intraday trading?
For intraday trading, focus on strike prices with high volume and tight bid-ask spreads to ensure liquidity. Monitor changes in open interest and premiums during the trading session to detect shifts in market sentiment. Combine option chain data with real-time price action and technical indicators for more reliable signals.
Can beginners use the Bank Nifty option chain effectively?
Yes, but beginners should first understand core options concepts including strike price, premium, expiration, open interest, and implied volatility. Start by observing the chain without trading to recognize patterns in how data moves as the index price changes. Paper trading or using a demo account can help build familiarity before committing real capital.
- What is the Bank Nifty option chain?
- The Bank Nifty option chain is a table that lists all available call and put option contracts for the Bank Nifty index, organized by strike price, with columns for premium, open interest, volume, bid, ask, and last price.
- How do you find the ATM strike price in the option chain?
- The at-the-money (ATM) strike price is the strike price in the option chain that is closest to the current market price of the Bank Nifty index at any given moment.
- What does high open interest in a strike price mean?
- High open interest at a particular strike price indicates strong market participation and interest at that level, often signaling a potential support or resistance zone for the Bank Nifty index.
- Why is the bid-ask spread important in the option chain?
- The bid-ask spread represents the difference between the highest price a buyer is willing to pay and the lowest price a seller is willing to accept. A narrow spread indicates high liquidity and lower transaction costs for traders.
- How often does the option chain data update?
- The Bank Nifty option chain data updates in real time during market hours as trades are executed, with bid and ask prices adjusting continuously based on market activity.
- Does the NSE website show the Bank Nifty option chain for free?
- Yes, the NSE India website provides the Bank Nifty option chain data free of charge under its derivatives market section, and many brokerage platforms also display it at no cost.