Financial Statement Analysis: Balance Sheet, Income Statement, And Cash Flow
Understanding the Balance Sheet, Income Statement, and Cash Flow Statement

Balance Sheet

A balance sheet shows a company’s financial position at a single point in time. It lists what the company owns (assets), what it owes (liabilities), and the value left for shareholders (equity). The formula is: [ \text{Assets} = \text{Liabilities} + \text{Shareholders’ Equity} ]. Learn more in our fundamental analysis course.
Example:
Assets:
- Current Assets:
- Cash and Cash Equivalents: $500,000
- Accounts Receivable: $300,000
- Non-current Assets:
- Property, Plant, and Equipment: $1,200,000
Liabilities:
- Current Liabilities:
- Accounts Payable: $150,000
- Short-term Debt: $100,000
- Non-current Liabilities:
- Long-term Debt: $700,000
Shareholders' Equity:
- Common Stock: $300,000
- Retained Earnings: $750,000

The income statement, also known as the profit and loss statement, shows a company’s revenues and expenses over a specific period. It provides insights into a company’s profitability. The formula for the income statement is: [ \text{Net Income} = \text{Revenue} – \text{Expenses} ]
Example:
Revenue:
- Sales Revenue: $2,000,000
- Interest Income: $50,000
Expenses:
- Cost of Goods Sold: $800,000
- Operating Expenses: $300,000
- Interest Expense: $20,000
- Income Tax Expense: $150,000
Cash Flow Statement

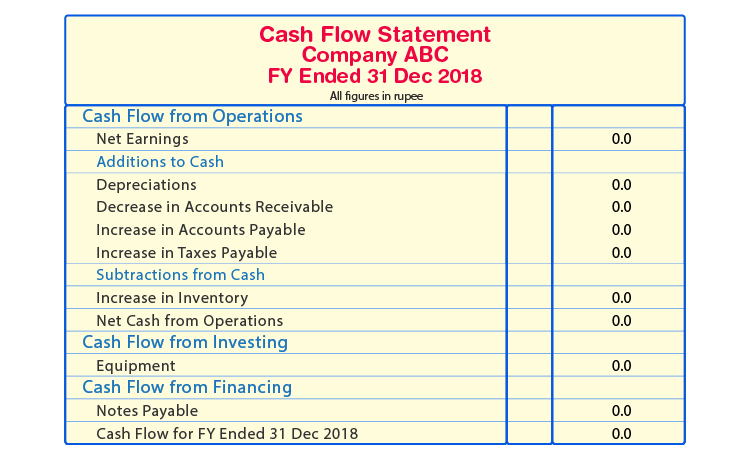
The cash flow statement tracks the inflow and outflow of cash in a company. It is divided into three sections: operating activities, investing activities, and financing activities. The formula for the cash flow statement is: [ \text{Net Cash Flow} = \text{Cash from Operating Activities} + \text{Cash from Investing Activities} + \text{Cash from Financing Activities} ]
Example:
Operating Activities:
- Net Income: $500,000
- Depreciation and Amortization: $100,000
- Changes in Working Capital: $50,000
Investing Activities:
- Purchase of Property, Plant, and Equipment: ($300,000)
- Sale of Investments: $200,000
Financing Activities:
- Issuance of Long-term Debt: $400,000
- Repayment of Short-term Debt: ($100,000)
How to Analyze Financial Statements Step by Step
Your task: Compare the balance sheet, income statement, and cash flow statement to assess the company’s financial health and performance.

Follow this simple plan:
Gather the financial reports. Get the balance sheet, income statement, and cash flow statement for the current and prior period. You can find these in the company’s annual report or accounting software.
Pick key financial metrics. Choose the ratios that help you measure performance, such as liquidity, profitability, and solvency ratios — including stock valuation techniques. For example, use the current ratio, return on equity, operating cash flow ratio, and debt-to-equity ratio.
Run horizontal and vertical analysis. Compare data over time (horizontal) and across categories (vertical) to spot trends. For example, calculate the percentage change in each line item between periods, and show each item as a percentage of a base figure within the same period.
Interpret what the numbers mean. Look at the trends and changes in your key metrics to judge the company’s financial health, profitability, and efficiency. For instance, a drop in the current ratio or a rise in operating cash flow tells you something important.
Share your findings in a clear report. Summarize your main insights and recommendations based on the balance sheet, income statement, and cash flow analysis. Give stakeholders a full picture of the company’s financial performance.

Free Registration for Stock Market Tips ( Advisory Services)
As per the SEBI rules, we will provide our Services only to those clients who have Complete Risk Profile. Fill This Registration Form and
Contact us on
- Whatsapp @ +91 95999 69624
- Call Us @ +91 9650 890 321
for further process.
Risk Profiling is COMPULSORY
Financial Statement Analysis: Definition and Key Concepts
Financial statement analysis is the process of evaluating a company's financial reports — primarily the balance sheet, income statement, and cash flow statement — to assess its financial health, profitability, and long-term viability. By examining relationships between line items, trends over time, and key financial ratios, analysts and investors can make informed decisions about a company's performance and valuation. The three statements are interconnected: net income from the income statement flows into retained earnings on the balance sheet and serves as the starting point for the operating activities section of the cash flow statement.
What is included in financial statement analysis?
Financial statement analysis typically includes horizontal analysis (comparing financial data across multiple periods), vertical analysis (expressing each line item as a percentage of a base figure within the same period), and ratio analysis (using liquidity, profitability, solvency, and efficiency ratios). Each approach provides a different lens for interpreting the raw numbers in the financial reports.
Why are the balance sheet, income statement, and cash flow statement analyzed together?
The three financial statements serve different but complementary purposes. The balance sheet shows financial position at a point in time, the income statement shows profitability over a period, and the cash flow statement reveals actual cash generation and usage. Analyzing them together helps detect inconsistencies — for example, rising net income on the income statement with declining operating cash flow on the cash flow statement could signal earnings quality concerns.
What are the most common financial ratios used in financial statement analysis?
Common ratios include liquidity ratios such as the current ratio and quick ratio, profitability ratios such as return on equity (ROE) and net profit margin, solvency ratios such as debt-to-equity, and efficiency ratios such as asset turnover. These ratios are calculated using data from all three financial statements and are compared against industry benchmarks or historical trends.
- What is the difference between financial statement analysis and fundamental analysis?
- Financial statement analysis is a subset of fundamental analysis. Fundamental analysis evaluates a company's intrinsic value by examining financial statements, management, industry conditions, and economic factors, whereas financial statement analysis focuses specifically on the quantitative data in the financial reports.
- How often should financial statements be analyzed?
- Financial statements are typically analyzed on a quarterly basis after each earnings release and annually after the release of the audited annual report. Investors may also conduct analysis whenever considering a new investment or reviewing a portfolio holding.
- Can financial statement analysis predict a company's future performance?
- Financial statement analysis provides insights into past and present performance but cannot guarantee future results. However, consistent trends in revenue growth, profit margins, and cash flow generation are often used as indicators of a company's future trajectory when combined with broader market and industry analysis.
- What are the limitations of financial statement analysis?
- Limitations include reliance on historical data, differences in accounting policies between companies, potential for earnings manipulation, and the fact that financial statements do not capture intangible assets such as brand value or employee expertise. Comparing companies across industries using the same ratios may also produce misleading conclusions.