

What Is the P/E Ratio and Why It Matters in Stock Analysis

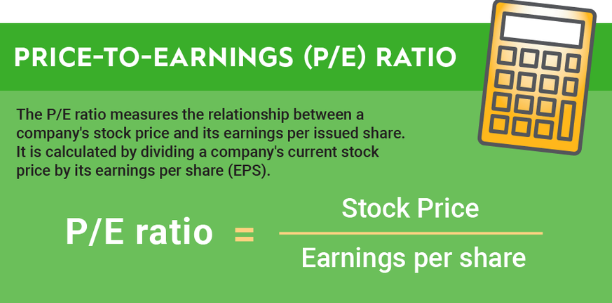
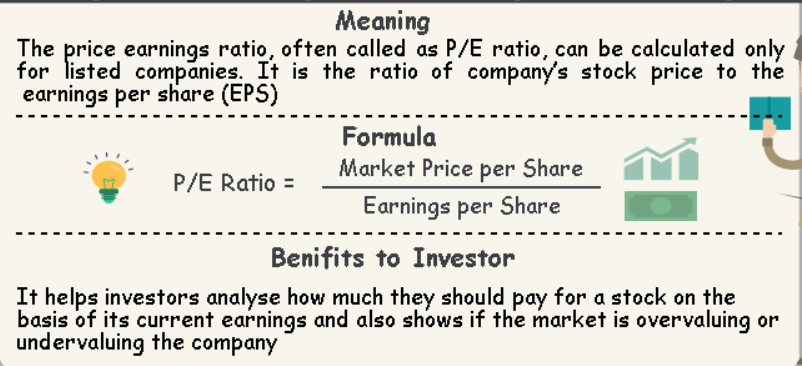
The P/E ratio shows how much investors are willing to pay for each dollar of a company’s earnings. It is one of the most common tools used to evaluate a stock’s value.
# Example:
# Company A has a stock price of $100 and earnings per share (EPS) of $5.
# Its P/E ratio would be 20 ($100 / $5).
P/E Ratio Calculation
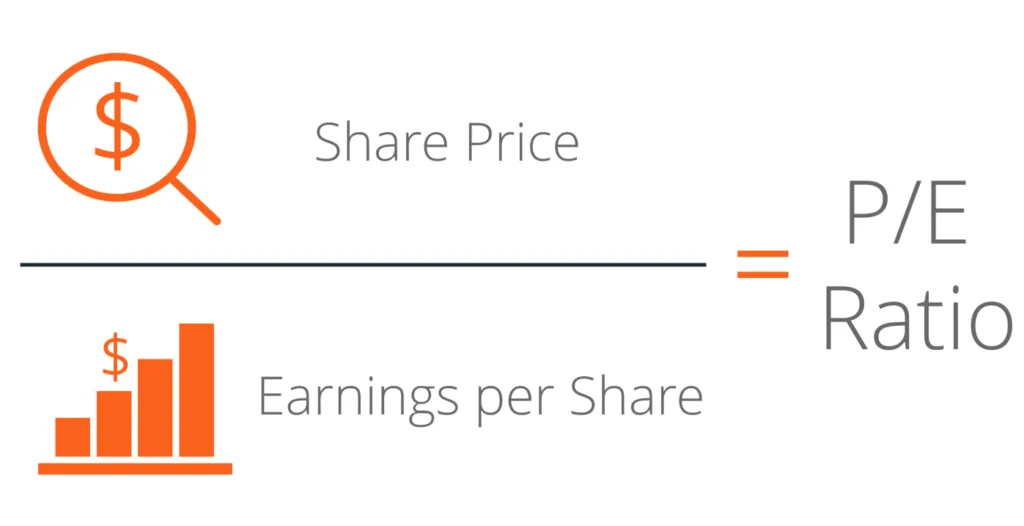
To calculate the P/E ratio, divide the current stock price by the earnings per share (EPS). EPS is usually based on the past 12 months or estimated future earnings. A high P/E ratio can mean investors expect strong growth. A low P/E ratio may mean the stock is undervalued or growth is expected to be slow.
# Example:
# Company B has a stock price of $50 and TTM EPS of $2.50.
# Its P/E ratio would be 20 ($50 / $2.50).
How the P/E Ratio Helps in Stock Analysis

The P/E ratio helps investors compare stocks in the same industry. It shows if a stock is overvalued, undervalued, or fairly priced based on earnings. But you should also look at growth, industry trends, and market conditions.
# Example:
# Company C operates in the same industry as Company A and has a P/E ratio of 15.
# This suggests that investors are willing to pay less for each dollar of Company C's earnings compared to Company A.
Limitations and Considerations
The P/E ratio is useful, but it has limits. It may not count one-time expenses or unusual events that affect earnings. Comparing P/E ratios across different industries can also be misleading. Use the P/E ratio along with broader valuation techniques and other financial tools for a fuller picture.
# Example:
# Company D has a P/E ratio of 25, but it recently incurred a significant one-time expense, impacting its earnings.
# In this case, the P/E ratio may not accurately reflect the company's true valuation.
Forward P/E Ratio and Growth
The forward P/E ratio uses expected future earnings instead of past earnings. This helps investors look ahead. For fast-growing companies, check the PEG ratio (P/E divided by growth rate). A low PEG ratio compared to similar companies may mean the stock is undervalued with strong growth ahead.
# Example:
# Company E is expected to have significant earnings growth in the next year, resulting in a forward P/E ratio of 15.
# Considering its high growth potential, the PEG ratio of 0.8 suggests that the stock may be undervalued.
The P/E ratio is a key tool for investors who want to make smarter decisions. When used with other financial metrics and industry research, it helps you compare stocks and spot potential opportunities.
# Example:
# By analyzing the P/E ratios of multiple companies in the same sector, investors can identify stocks that may be undervalued or overvalued relative to their earnings potential.
To do: Calculate the P/E ratio for a stock and learn what it tells you about the company’s value.
Short step-by-step plan:
Find the stock price and EPS:
- Go to a financial website like Yahoo Finance and find the current stock price and the earnings per share (EPS) for the company you want to analyze.
- For example, if you are interested in analyzing Apple Inc. (AAPL), you can find the stock price and EPS on Yahoo Finance.
Calculate the P/E ratio:
- Divide the current stock price by the EPS to calculate the P/E ratio.
- For example, if the current stock price of AAPL is $150 and the EPS is $5, then the P/E ratio would be 150/5 = 30.
Interpret the P/E ratio:
- A higher P/E ratio means investors pay more for each dollar of earnings. This can mean the stock is overvalued. A lower P/E ratio may mean the stock is undervalued.
- For the example of AAPL, a P/E ratio of 30 suggests that investors are willing to pay 30 times the company’s earnings, indicating a relatively high valuation.
Compare with industry average and historical P/E:
- Compare the calculated P/E ratio with the industry average and the company’s historical P/E ratio to gain further insights into the stock’s valuation.
- For AAPL, compare the P/E ratio of 30 with the industry average and previous P/E ratios to assess its relative valuation.
Make informed investment decisions:
- Use the P/E ratio with other analysis tools to decide if you should buy, hold, or sell the stock.
- Based on the calculated P/E ratio and additional analysis, decide whether to buy, hold, or sell the stock.


