Technical Analysis Tools For Short-Term Stock Market Investment

 📈 Candlestick Patterns

The Origin of Candlestick Patterns

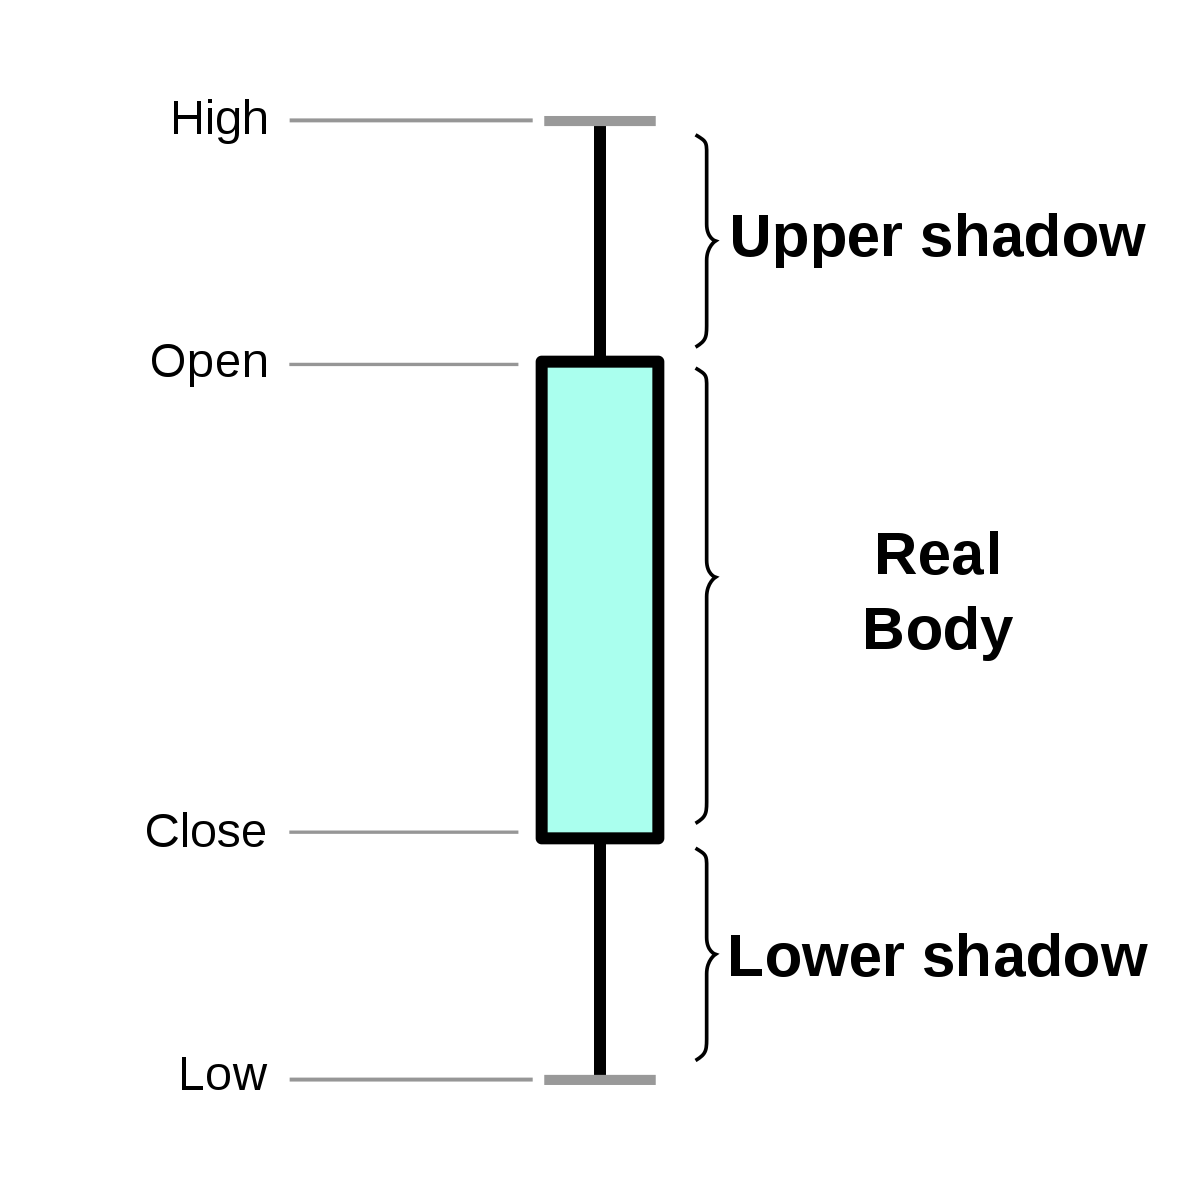
Candlestick pattern recognition is a key part of technical analysis for short term trading. These patterns show what traders are thinking and feeling. They can help you predict where prices may go next. For example, the “Doji” pattern shows that buyers and sellers are evenly matched. This can signal a potential trend reversal.


import mplfinance as mpf
import pandas as pd

# Create a simple Doji candlestick pattern
data = pd.read_csv('stock_data.csv', index_col=0, parse_dates=True)
ohlc = data['Close'].resample('1D').ohlc()
ohlc.reset_index(inplace=True)

mpf.plot(ohlc, type='candle', style='charles', volume=False)

Fibonacci Retracement: Find Support and Resistance Levels

Fibonacci Retracement

Fibonacci retracement levels help traders find possible support and resistance levels. These levels come from the Fibonacci sequence. Traders use them to guess where prices might turn around. They also help plan when to buy or sell. For example, the 61.8% level is often seen as a key spot where price reversals can happen.

// Calculate Fibonacci retracement levels
const high = 100;
const low = 50;
const retracement_61_8 = high - ((high - low) * 0.618);
console.log(`61.8% retracement level: ${retracement_61_8}`);

Moving Averages and MACD: Spot Market Trends

Moving Average Convergence Divergence (MACD)

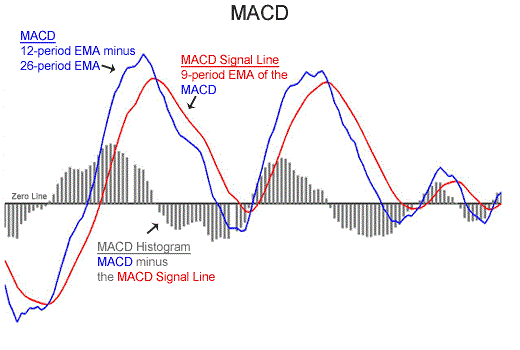
Moving averages and the MACD are popular technical analysis tools for short term trading. They help traders spot trends, momentum, and good times to enter or exit a trade. For example, when the MACD line crosses above the signal line, it is often seen as a buy signal.

import pandas as pd
import matplotlib.pyplot as plt

# Calculate 50-day and 200-day moving averages
data = pd.read_csv('stock_data.csv', index_col=0, parse_dates=True)
data['MA_50'] = data['Close'].rolling(window=50).mean()
data['MA_200'] = data['Close'].rolling(window=200).mean()

# Plot the moving averages
plt.figure(figsize=(12, 6))
plt.plot(data['Close'], label='Close Price')
plt.plot(data['MA_50'], label='50-day MA')
plt.plot(data['MA_200'], label='200-day MA')
plt.legend()
plt.show()

RSI: Spot Overbought and Oversold Conditions

Relative Strength Index (RSI)

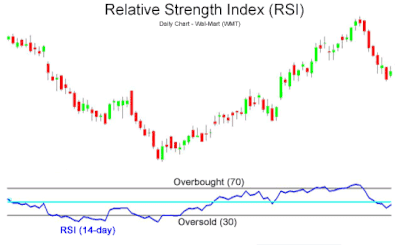
The RSI is a tool that measures how fast prices are moving. It moves between 0 and 100. Traders use it to spot overbought or oversold conditions. A reading above 70 means the stock may be overbought. A reading below 30 means it may be oversold.

// Calculate RSI
const prices = [60, 62, 65, 63, 68, 70, 72, 75, 80, 78, 82, 85, 88, 90];
const periods = 14;
let avgGain = 0;
let avgLoss = 0;

for (let i = 1; i < periods; i++) {
  const change = prices[i] - prices[i - 1];
  if (change > 0) {
    avgGain += change;
  } else {
    avgLoss -= change;
  }
}

avgGain /= periods;
avgLoss /= periods;

const RS = avgGain / avgLoss;
const RSI = 100 - (100 / (1 + RS));
console.log(`RSI: ${RSI}`);

Bollinger Bands: Measure Market Volatility

Bollinger Bands

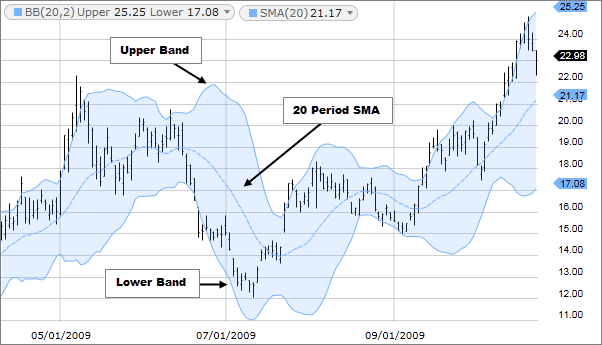
Bollinger Bands have a middle band (a simple moving average) and two outer bands. The outer bands sit above and below the middle band. They help measure market volatility. When the price hits the upper band, the market may be overbought. When it hits the lower band, the market may be oversold.

import pandas as pd
import matplotlib.pyplot as plt

# Calculate Bollinger Bands
data = pd.read_csv('stock_data.csv', index_col=0, parse_dates=True)
data['20MA'] = data['Close'].rolling(window=20).mean()
data['20SD'] = data['Close'].rolling(window=20).std()
data['UpperBand'] = data['20MA'] + (2 * data['20SD'])
data['LowerBand'] = data['20MA'] - (2 * data['20SD'])

# Plot the Bollinger Bands
plt.figure(figsize=(12, 6))
plt.plot(data['Close'], label='Close Price')
plt.plot(data['20MA'], label='20-day MA')
plt.plot(data['UpperBand'], label='Upper Band')
plt.plot(data['LowerBand'], label='Lower Band')
plt.legend()
plt.show()

By mastering these intraday market analysis tools, investors can better understand the market. They can make smarter choices when trading stocks for the short term.

Try this: Practice using one technical analysis tool for short term stock trading.

Simple step-by-step plan:

  1. Pick a tool: Choose one popular tool such as moving averages, RSI, or Bollinger Bands.

  • Example: Practice using the RSI to spot overbought and oversold conditions in stock prices.

  1. Learn how it works: Understand what the tool tells you and how to read its signals.

  • Example: Learn how RSI measures price movement speed and how it can signal trend changes.

  1. Get stock data: Find historical price data for a stock or index to test your tool.

  • Example: Download one year of historical price data for a selected stock.

  1. Apply the tool: Use the data to test the tool and see what signals it gives.

  • Example: Calculate RSI values and find overbought and oversold signals in the data.

  1. Check the results: See how well the tool helped spot short term trading opportunities.

  • Example: Check if RSI correctly predicted short term price moves and note how it performed.

  1. Repeat with other stocks: Try the same tool on different stocks and time frames to get better.

  • Example: Use RSI on several stocks and compare how it works in different market conditions.

best bank nifty option tips provider in india

Free Registration for Stock Market Tips ( Advisory Services)

As per the SEBI rules, we will provide our Services only to those clients who have Complete Risk Profile. Fill This Registration Form  and 
Contact us on

  • Whatsapp @ +91 95999 69624
  • Call Us @ +91 9650 890 321 
    for  further process.

Risk Profiling is COMPULSORY

What Are the Best Technical Analysis Tools for Short Term Trading?

Technical analysis tools for short term trading help traders evaluate price movements and make entry and exit decisions over holding periods ranging from minutes to days. These tools rely on historical price, volume, and momentum data rather than fundamental valuation. The most commonly used technical analysis tools for short term trading include candlestick patterns, moving averages, the Relative Strength Index (RSI), the Moving Average Convergence Divergence (MACD), Bollinger Bands, and Fibonacci retracement levels. Each tool serves a different purpose: some identify trend direction, others measure momentum or volatility, and some highlight potential support and resistance zones.

What is technical analysis for short term trading?

Technical analysis for short term trading is the practice of analyzing past market data, primarily price and volume, to forecast future price movements over brief time horizons. Traders apply chart patterns, indicators, and statistical measures to identify opportunities in intraday, swing, or momentum trades. Unlike long term investing, short term technical analysis focuses on capturing small price fluctuations rather than holding for fundamental growth.

How do candlestick patterns help short term traders?

Candlestick patterns help short term traders by visualizing the open, high, low, and close prices within a specific time period. Patterns such as doji, hammer, engulfing, and shooting star reveal shifts in market sentiment and potential reversal points. Traders use these visual signals to time entries and exits with higher precision.

How does RSI work as a short term trading tool?

The Relative Strength Index (RSI) works as a momentum oscillator that measures the speed and magnitude of recent price changes on a scale from 0 to 100. In short term trading, RSI readings above 70 typically indicate overbought conditions, while readings below 30 suggest oversold conditions. Traders use these thresholds to anticipate potential reversals or pullbacks.

How is MACD used for short term trades?

The Moving Average Convergence Divergence (MACD) is used for short term trades to identify changes in trend strength and momentum. It consists of two moving averages and a histogram. A common signal occurs when the MACD line crosses above the signal line, indicating bullish momentum, or below it, indicating bearish momentum.

What role do Bollinger Bands play in short term trading?

Bollinger Bands measure market volatility by plotting a simple moving average with upper and lower bands set at a standard deviation multiplier. In short term trading, prices touching or breaching the upper band suggest overbought conditions, while touching the lower band suggests oversold conditions. Band contractions, known as squeezes, often precede sharp price moves.

How can Fibonacci retracement levels be applied to short term trading?

Fibonacci retracement levels are applied to short term trading by drawing horizontal lines at key ratios (23.6%, 38.2%, 50%, 61.8%, and 78.6%) between a price high and low. Traders watch these levels as potential support zones during pullbacks or resistance zones during retracements. The 61.8% level is considered the most significant for potential reversals.

What is the difference between leading and lagging indicators in short term trading?
Leading indicators, such as RSI and stochastic oscillators, attempt to predict future price movements by signaling overbought or oversold conditions before they occur. Lagging indicators, such as moving averages and MACD, follow price action and confirm trends after they have started. Short term traders often combine both types to balance early signals with confirmation.
How can multiple technical analysis tools be combined for short term trading?
Traders combine multiple tools by using one indicator to identify the trend direction and another to time entries. For example, a trader might use a moving average to confirm the overall trend and RSI to find overbought or oversold entry points. Conflicting signals between tools can indicate uncertain market conditions.
What time frames work best with technical analysis tools for short term trading?
Common time frames for short term trading include 1-minute, 5-minute, 15-minute, hourly, and daily charts, depending on the holding period. Scalpers typically use the shortest time frames, while swing traders prefer hourly or daily charts. The chosen time frame should match the trader's intended holding period and risk tolerance.
Can technical analysis tools guarantee profitable short term trades?
No technical analysis tool can guarantee profitable trades. These tools provide probabilistic signals based on historical data, not certain predictions. Market conditions, news events, and trader psychology can cause indicators to produce false signals. Risk management and trade discipline remain essential.
Scroll to Top