Flag Patterns

Their Significance In Signaling A Potential Trend Continuation

What Is a Flag Pattern in Trading?

A flag pattern is a chart shape that shows a brief pause in a strong price move. It is one of the most reliable continuation patterns in trading. By learning to recognize chart patterns like the flag pattern, traders can spot when a trend is likely to keep going and plan their trades.

🚩 What is a Flag Pattern?

What is a Flag Pattern

A flag pattern forms when the price moves into a narrow range after a sharp rise or drop. It looks like a flag on a pole. This pattern is a short pause in the market. It tells traders that the previous trend will likely continue once the pattern ends.

📈 Bullish and Bearish Flags

Bullish and Bearish Flags

  • Bullish Flag: Forms during an uptrend. It signals that the upward move will likely continue.

  • Bearish Flag: Forms during a downtrend. It suggests that the downward move will likely keep going.

🔍 Recognizing Flag Patterns

To spot a flag pattern, look for:

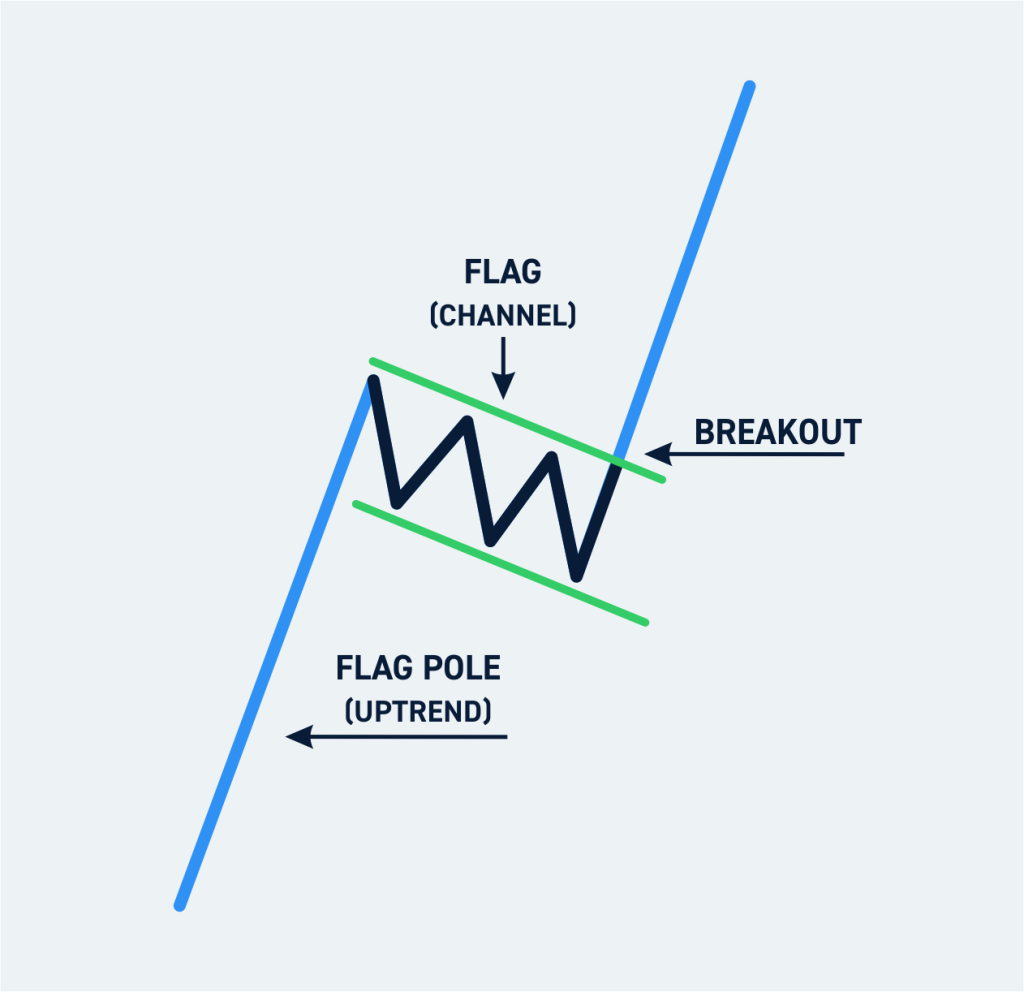
  • A strong, straight price move that creates the flagpole.

  • A rectangular consolidation that tilts against the trend and forms the flag.

  • Volume that drops during the flag formation.

  • A breakout in the trend’s direction that happens on higher volume.

📊 Example of a Flag Pattern

Imagine XYZ stock jumps from $50 to $60 in a few days. This creates a steep flagpole. Then the price steadies between $58 and $59. It tilts down slightly, forming the flag. Volume drops during this time. After a few days, XYZ breaks above the flag on high volume. The uptrend continues.

📚 Real-World Example

Example of a Flag Pattern

Consider a stock like Apple Inc. (AAPL) after a strong earnings report. The stock price jumps up and forms a flagpole. It then moves sideways and creates a flag pattern. Traders who see this pattern can expect the uptrend to continue if and when the stock breaks out of the flag on increased volume.

🔑 Key Takeaways

  • Flag patterns signal that a trend will likely continue.

  • A flag pattern has two parts: a flagpole and a flag. Volume helps confirm the pattern.

  • Breakouts need higher volume to be confirmed.

  • Flags can be bullish or bearish, depending on the main trend.

Learning to spot flag patterns helps traders predict when a trend will resume. This can lead to better trading decisions. But remember – no pattern is perfect. Always use flag patterns with other tools and good risk management.

Quick guide to flag patterns:

  1. Understand what a flag pattern is:

  • A flag pattern is a continuation pattern. It shows a short pause in a trend after a strong price move.

  • Look at a real chart where a flag pattern formed after a big price jump. Find the flagpole (the first strong move) and the flag (the pause that follows).

  1. Know why flag patterns matter:

  • Flag patterns often mean the market is taking a short break before the trend continues. This can help you predict what happens next.

  • Many traders see flag patterns as a reliable sign that a trend will keep going.

  • For example, a flag pattern that formed after a stock’s uptrend correctly signaled the trend would continue – giving traders a chance to profit.

  1. Learn the different types of flag patterns:

  • There are two main types. A bullish flag forms after an upward price move. A bearish flag forms after a downward price move.

  • Look at charts of both types to see how they differ. Real price charts make it easier to spot them in your own trading.

best bank nifty option tips provider in india

Free Registration for Stock Market Tips ( Advisory Services)

As per the SEBI rules, we will provide our Services only to those clients who have Complete Risk Profile. Fill This Registration Form  and 
Contact us on

  • Whatsapp @ +91 95999 69624
  • Call Us @ +91 9650 890 321 
    for  further process.

Risk Profiling is COMPULSORY

Everything You Need to Know About Flag Patterns

A flag pattern is a continuation chart pattern that signals a brief consolidation in price after a strong directional move, after which the prevailing trend is expected to resume. It is composed of a steep price move called the flagpole followed by a rectangular, counter-trend consolidation called the flag. Flag patterns are used by traders across stocks, forex, and crypto markets to identify potential entry points in the direction of the trend.

What is a flag pattern in trading?

A flag pattern is a technical chart formation that consists of a sharp price move (the flagpole) followed by a period of sideways or slightly counter-trend movement (the flag). The flag typically slopes against the prevailing trend and appears as a narrow, rectangular channel on the price chart. Volume usually declines during the flag formation and increases sharply at the breakout, confirming the pattern.

How do you identify a flag pattern on a chart?

To identify a flag pattern, look for a steep, nearly vertical price move that creates the flagpole. The flag itself appears as a rectangular consolidation that tilts slightly against the main trend. For a bullish flag, the consolidation tilts downward. For a bearish flag, it tilts upward. Volume should drop during the flag phase and spike when price breaks out in the direction of the original trend.

What is the difference between a bullish flag and a bearish flag?

A bullish flag forms during an uptrend and involves a downward-tilting consolidation. It signals that the price is pausing before continuing higher. A bearish flag forms during a downtrend and involves an upward-tilting consolidation. It signals that the price is pausing before continuing lower. Both patterns share the same structure of a flagpole followed by a flag, but their trend direction and flag tilt are opposite.

What volume patterns confirm a flag pattern?

Volume confirmation is essential for a valid flag pattern. Volume should be heavy during the flagpole formation, decline noticeably during the flag consolidation, and then increase sharply at the breakout point. A breakout without a volume increase is considered weak and may result in a false signal. Traders often wait for a volume spike above the flag-phase average before entering a trade.

How do you trade a flag pattern?

Traders typically enter a trade when the price breaks out of the flag formation in the direction of the prevailing trend. The price target is estimated by measuring the height of the flagpole and projecting that distance from the breakout point. A stop-loss is commonly placed just below the lower boundary of the flag (for bullish flags) or just above the upper boundary (for bearish flags).

What is a flag pattern in stock trading?
A flag pattern in stock trading is a continuation chart pattern that forms after a strong price move, showing a brief consolidation before the trend resumes.
How reliable are flag patterns?
Flag patterns are considered among the more reliable continuation patterns, especially when confirmed by volume. However, no pattern guarantees the outcome, and flags should be used alongside other technical tools.
What is the difference between a flag and a pennant?
A flag forms as a rectangular channel that tilts against the trend, while a pennant forms as a small symmetrical triangle. Both are continuation patterns with similar trading logic.
What timeframe works best for flag patterns?
Flag patterns can appear on any timeframe, but they are most commonly traded on hourly, daily, and weekly charts. Shorter timeframes produce more frequent but less reliable signals.
Can flag patterns fail?
Yes, flag patterns can fail if the price breaks out in the opposite direction or if the breakout lacks sufficient volume. False breakouts are a common risk, which is why traders use stop-loss orders.
How do you set a stop-loss for a flag pattern trade?
For a bullish flag, place the stop-loss just below the lower boundary of the flag consolidation. For a bearish flag, place it just above the upper boundary of the flag.
Scroll to Top