📐 Types of Triangle Patterns

There are three main types of triangle patterns that traders look for on charts:
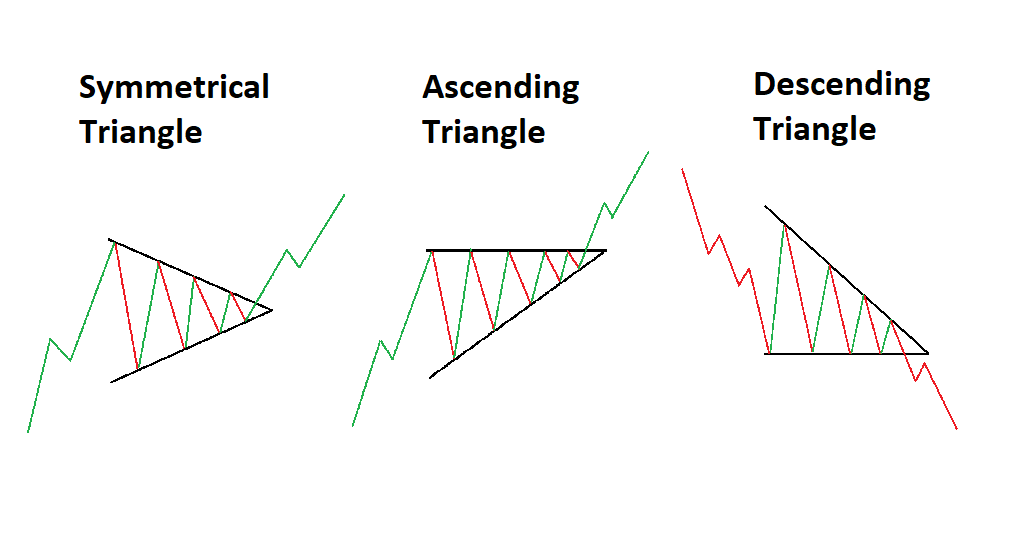
🔺 Ascending Triangle: This is a bullish pattern that usually forms during an uptrend as a continuation pattern. It has a flat top and an ascending lower trendline.
🔻 Descending Triangle: This pattern is the opposite of the ascending triangle. It is a bearish pattern that typically forms during a downtrend. It has a flat bottom and a descending upper trendline.
⚖️ Symmetrical Triangle: This pattern is formed when there’s uncertainty in the markets and the highs and the lows converge towards each other. It can break out in either direction.
🔍 Identifying Triangle Patterns
To spot a triangle pattern, you need to look for a series of peaks and troughs that can be connected to form the triangle’s shape. Here’s how you can identify each type:
Example:
- Ascending Triangle: Look for at least two similar highs and higher lows.
- Descending Triangle: Look for at least two similar lows and lower highs.
- Symmetrical Triangle: Look for converging trendlines with similar slopes.
📈 Trading Triangle Patterns

Once you’ve identified a triangle pattern, you can use it to anticipate potential price movements.
Ascending Triangle: Enter a long position when the price breaks above the flat top of the triangle. The breakout should be on increased volume for confirmation.
Descending Triangle: Consider a short position when the price breaks below the flat bottom. Again, look for a volume increase to confirm the breakout.
Symmetrical Triangle: Wait for a clear breakout from the converging trendlines before entering a trade. The direction of the breakout will indicate whether to go long or short.
📊 Real-World Examples
Traders use triangle patterns to help plan their trades. For example, when an ascending triangle forms during an uptrend and the price breaks above the flat top with rising volume, it may signal a good time to enter a long position. Always wait for the breakout to confirm before taking a trade.
📉 Why Traders Use Triangle Patterns
Triangle patterns help traders understand market sentiment and spot possible price moves. By learning to identify and trade these patterns, you can strengthen your trading strategy. Practice is key – backtest your pattern recognition on historical charts to build skill and confidence.
How to Trade Triangle Patterns: A Simple Checklist
Learn each pattern. Study ascending, descending, and symmetrical triangles. Know how they form and what they tell you about the trend.
Practice on past charts. Use a charting platform to find triangle patterns in historical price data. This helps train your eye to spot them in real time. Practice analyzing stock price charts to see how price moved after each pattern.
Watch the volume. Volume often drops as the triangle gets tighter and rises sharply on the breakout. This helps confirm if the breakout is real.
Trade with a plan. Apply what you have learned to live charts. Keep a trading journal to track your results and improve over time.