
Price Patterns Can Tell a Story?

📈 What Are Support and Resistance?

Support and resistance levels are like the psychological barriers of the stock market. They represent the points on a chart where the price of a stock tends to reverse its direction.
Support is the level where buying interest is significantly strong and surpasses the selling pressure. It’s like a safety net or floor where the price tends to bounce upwards.
Resistance is the level where selling interest overcomes buying pressure. It’s akin to a ceiling, capping the upward momentum of the price.
🔍 Identifying Support and Resistance
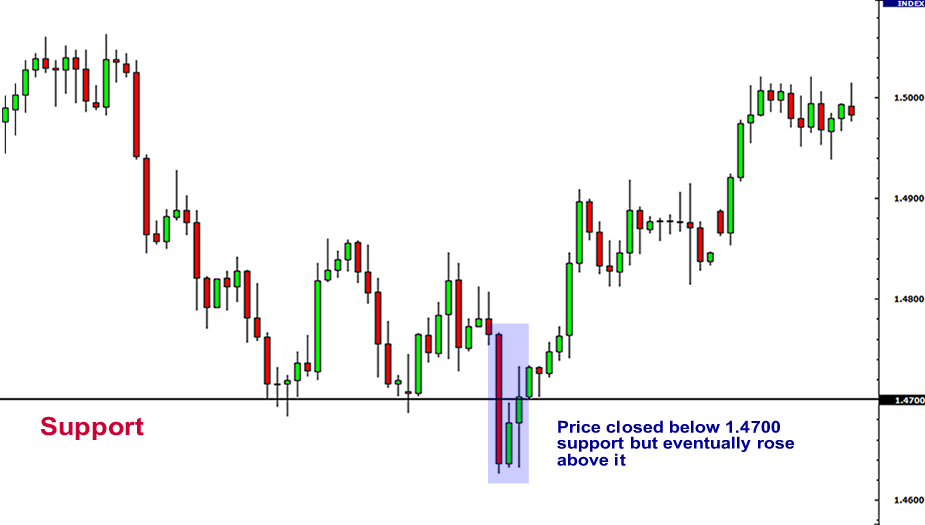
To spot these levels, look for:
Horizontal Lines: Drawn at the swing lows for support and swing highs for resistance.
Trend Lines: Upward for support in uptrends and downward for resistance in downtrends.
Moving Averages: Often act as dynamic support or resistance.
Price Patterns: Such as ‘head and shoulders’ or ‘double tops’ can indicate resistance.
Example: In a 6-month chart of XYZ stock, a horizontal line at $50 where the price bounced several times could indicate a strong support level.
📊 The Psychology Behind the Levels

Support and resistance are not just lines on a chart; they represent the collective psychology of the market participants. A support level indicates a concentration of buyers, while a resistance level indicates a point where sellers start to outnumber buyers.
💡 Trading Decisions Based on Support and Resistance
Buying Near Support: Traders often look to buy around support levels, betting on the price bouncing back up.
Selling Near Resistance: Conversely, selling around resistance levels can be a strategy to capitalize on the price ceiling.
🔄 Breakouts and Breakdowns
Breakout: When the price moves above a resistance level, it could indicate a strong upward trend.
Breakdown: Conversely, falling below a support level might signal a new bearish trend.
Real Story: In 2020, stock ABC broke through its long-term resistance at $30 and surged to $45, rewarding traders who recognized the breakout early.
📝 The Role of Volume

Volume is a key indicator that can confirm the strength of support and resistance. High volume at these levels strengthens their significance.
🚨 False Breakouts and Breakdowns
Not all breakouts/breakdowns are genuine; some may be traps. It’s important to look for confirmation before making a trade.
🛠️ Tools for Traders
Technical analysis software and charting tools can help identify these levels more accurately. Common tools include:
Fibonacci Retracement
Pivot Point Calculators
Chart Pattern Recognition Software
🧠 Emotional Discipline and Risk Management
Remember, support and resistance levels are not infallible. Always use stop-loss orders and maintain emotional discipline to manage risks effectively.
🔄 The Self-Fulfilling Nature of Support and Resistance
Because many traders watch these levels, their actions can reinforce the levels’ significance, creating a self-fulfilling prophecy.
🔮 Support and Resistance in Different Market Conditions
Bull Markets: Resistance levels may be broken more frequently.
Bear Markets: Support levels may be breached more often.
📚 Continuous Learning
Stay informed about market trends and refine your ability to identify support and resistance levels. The more you practice, the better you’ll become at making informed trading decisions.