Support And Resistance

Concepts To Real Stock Market Scenarios

What Are Support and Resistance Levels?

Identifying Support and Resistance Levels

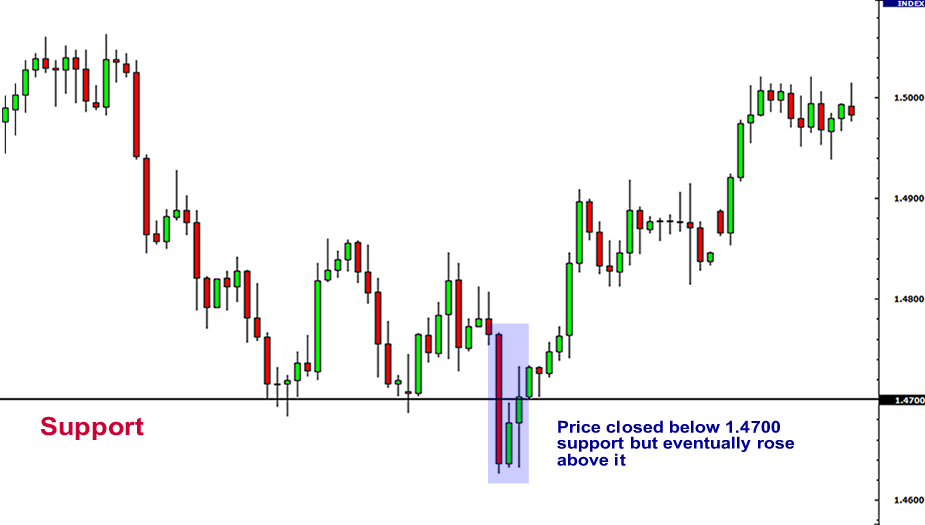
Support and resistance levels help traders read stock charts and make smarter decisions. In professional share market advisory, these are key tools. Support is a price where a stock tends to stop falling because buyers step in. Resistance is a price where a stock tends to stop rising because sellers take over. Think of support as a floor and resistance as a ceiling.

How to Identify Support and Resistance Levels

Support and Resistance

  • Look for multiple touches: The more times a price touches a level and reverses, the stronger it is.

  • Use historical data: Past support can become future resistance, and vice versa.

  • Notice round numbers: Psychological levels like $50 or $100 can act as support or resistance due to human psychology.

How to Apply Support and Resistance in Real Trading

Example 1: A Tech Stock Tests Key Levels

- Stock XYZ has bounced from $150 multiple times ➡️ Support
- It struggles to break above $170 ➡️ Resistance
- A strong volume breakout above $170 could signal a new uptrend

Real Story: A Retail Stock Breaks Support

A major retail stock held a support level of $30 for several months. When it finally broke below that price on high trading volume, the $30 level turned into resistance. The stock could not climb back above it.

How to Analyze Current Stock Charts

Line Charts

  • Choose a stock and find its 52-week high and low.

  • Look for the price levels with the most touches without breaking through.

  • Use technical indicators like moving averages to add another layer to your analysis.

Making Trading Decisions Based on Support and Resistance

How to Set Entry and Exit Points with Support and Resistance

  • Buy near support levels when you see bullish patterns.

  • Consider selling or shorting near resistance if bearish signals appear.

  • Place stop-loss orders just below support or above resistance to manage risk.

Example 2: A Pharma Stock Breaks Resistance

- Pharma Co. has a resistance at $75.
- News of a breakthrough drug approval helps it break through on high volume.
- Traders might enter a long position after the breakout, setting a stop-loss just below $75.

Example 3: An Energy Stock Hits Resistance

- Energy Inc. has hit $40 three times and reversed.
- It is approaching $40 again with decreasing volume.
- This could be a signal to sell before it potentially drops from the resistance level.

Keep Learning as Markets Change

Markets Change Over Time

Markets change, and so do support and resistance levels. Keep updating your charts and adjust your strategies as needed.

Real Story: A Tech Stock Breaks Through Resistance

A tech company stock traded between support at $100 and resistance at $120 for a year. After a major product breakthrough, it broke above $120 with a gap up on massive volume. This signaled a new trading range and an uptrend.

Keep Practicing to Build Your Skills

Practice Makes Perfect

Practice these concepts on different stocks and time frames. Over time, you will get better at spotting key support and resistance levels and managing trading risks effectively.

Quick practice plan:

  1. Learn the basics: Understand what support and resistance levels are and why they matter in technical analysis.

  • Look at a real stock chart and find price points where the stock reversed direction.

  1. Find levels on charts: Use practical methods to spot support and resistance on any stock chart.

  • Study a historical chart and mark the key price levels where the stock stopped falling or rising.

  1. Use levels in trades: Apply support and resistance to decide when to enter or exit a trade.

  • Review a real trade example where support or resistance helped make a buy or sell decision.

  1. Practice on your own: Test your skills with practice charts and scenarios.

  • Look at a stock chart, find the support and resistance levels, and explain why you chose them.

best bank nifty option tips provider in india

Free Registration for Stock Market Tips ( Advisory Services)

As per the SEBI rules, we will provide our Services only to those clients who have Complete Risk Profile. Fill This Registration Form  and 
Contact us on

  • Whatsapp @ +91 95999 69624
  • Call Us @ +91 9650 890 321 
    for  further process.

Risk Profiling is COMPULSORY

Support and Resistance Levels: What Traders Need to Know

Support and resistance levels are price boundaries on a stock chart where a trending price tends to pause or reverse. A support level acts as a floor where buying pressure prevents further declines, while a resistance level acts as a ceiling where selling pressure halts further advances. Traders use these levels to identify potential entry and exit points, set stop-loss orders, and gauge the strength of a trend. These levels are not fixed lines but psychological zones that gain significance each time the price tests and reacts at them.

What exactly are support and resistance levels?

Support is a price zone where demand is strong enough to stop a stock from falling further. Resistance is a price zone where supply is strong enough to stop a stock from rising further. Together, they define the trading range within which a stock moves until a breakout or breakdown occurs. These levels are identified by looking at historical price points where the stock reversed direction multiple times.

How do you draw support and resistance levels on a chart?

Traders draw horizontal lines across price points where a stock reversed direction at least twice. The more times the price touches a level and bounces away, the stronger that level is considered. Swing highs and swing lows on daily, weekly, or intraday charts serve as the anchor points. Round numbers and previous high-volume zones often act as natural support or resistance.

What happens when price breaks through support or resistance?

When price breaks through a support level on high volume, the stock often continues downward, and the broken support may turn into a new resistance level. Similarly, when price breaks above resistance on strong volume, the stock tends to continue upward, and the broken resistance can become a new support level. This role reversal is one of the most reliable patterns in technical analysis.

How can support and resistance levels improve trading decisions?

Traders use support levels to plan buy entries and place stop-loss orders just below them. Resistance levels help identify profit-taking targets and potential short-selling zones. Combining these levels with volume analysis and candlestick patterns increases the probability of successful trades. A stock approaching a known resistance with declining volume, for example, suggests a reversal may be near.

What is a support level in stock trading?
A support level is a price zone where demand is strong enough to prevent a stock from falling further, often causing the price to bounce upward.
What is a resistance level in stock trading?
A resistance level is a price zone where selling pressure is strong enough to prevent a stock from rising further, often causing the price to reverse downward.
How many times should price touch a level for it to be considered valid?
A level becomes meaningful after at least two touches. Three or more touches make it a strong support or resistance zone that traders watch closely for potential reversals.
Can a support level become a resistance level after being broken?
Yes. After price breaks below a support level, that same price zone often acts as a new resistance level on subsequent rallies. This principle also works in reverse for broken resistance levels.
Do support and resistance levels work on all time frames?
Yes. Support and resistance levels appear on every time frame from one-minute charts to monthly charts, but levels on higher time frames such as daily and weekly charts carry more weight and are more widely watched.
What is the difference between horizontal and dynamic support and resistance?
Horizontal support and resistance are fixed price levels drawn from past swing highs and lows. Dynamic support and resistance come from technical indicators such as moving averages or trendlines that shift as price changes.
Scroll to Top