Technical Indicators
Popular Technical Indicators Such As RSI, MACD, And Bollinger Bands And Their Application In Stock Market Analysis
What Are Technical Indicators? A Guide to RSI, MACD, and Bollinger Bands

Technical indicators help traders and investors study market trends. They use math and price data to spot patterns. Learn how to use RSI, MACD, and Bollinger Bands to analyze market trends with indicators.
📊 Relative Strength Index (RSI)

The RSI is a momentum oscillator. It tracks how fast and how much a stock price changes. The RSI moves between 0 and 100. Traders use it to spot overbought or oversold conditions in a stock.
How to Calculate RSI
- Find the average gain and average loss over a set period. The default is 14 days.
- Divide the average gain by the average loss to get the relative strength (RS).
- Use this formula: RSI = 100 – (100 / (1 + RS))
How to Read RSI
- An RSI above 70 means a stock may be overbought. A price drop could follow.
- An RSI below 30 means a stock may be oversold. This can be a buying chance.
- If RSI and price move in opposite directions, a trend change may be near.
Example: If Reliance Industries Limited (NSE: RELIANCE) has an RSI of 75, it might be overbought. Traders may watch for a price correction.
📈 Moving Average Convergence Divergence (MACD)

The MACD is a trend-following momentum indicator. It shows the link between two moving averages of a stock’s price. It has three parts: the MACD line, the signal line, and the histogram.
MACD Line: The difference between the 12-day and 26-day exponential moving averages (EMAs).
Signal Line: The 9-day EMA of the MACD line.
Histogram: The difference between the MACD line and the Signal line.
Traders watch for signal line crossovers, centerline crossovers, and divergences to spot trade signals.
Example: If the MACD line of Tata Motors Limited (NSE: TATAMOTORS) crosses above the signal line, it is a bullish signal. This could be a good time to buy.
📉 Bollinger Bands: Measure Market Volatility

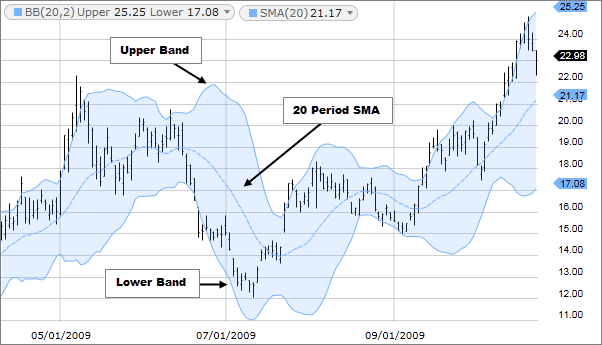
Bollinger Bands are a volatility indicator. They show how much a stock price moves up and down. The bands have three lines:
Middle Band: A 20-day simple moving average (SMA).
Upper Band: Middle band + (2 x standard deviation).
Lower Band: Middle band – (2 x standard deviation).
Stock prices tend to stay within the bands. When the price hits the upper or lower band, it may be overbought or oversold.
Example: If Infosys Limited (NSE: INFY) stock price moves above the upper Bollinger Band, it may be overbought. This can be a sell signal.
🔍 How to Use Technical Indicators in Trading

Technical indicators work best when used with other tools and market context. Here is how to add them to your trading plan:
Combine Indicators: Use more than one indicator to confirm signals. If RSI and MACD both show an overbought market, the signal is stronger.
Look for Divergences: If the price hits a new high but the RSI does not, the trend may be losing strength.
Adjust Settings: Change indicator settings like the SMA period to match your trading style and the stock’s volatility.
No indicator is perfect. Use them as helpful tools, not as your only guide. Always test your strategy on past data before you trade with real money.
📈📊🔔 Using RSI, MACD, and Bollinger Bands Together
Each indicator has its own strengths. But they can be even more powerful when used together. For example, if the RSI shows overbought, the MACD shows a bearish crossover, and the price hits the upper Bollinger Band, the stock may be due for a drop.
Practice Before You Trade with Real Money
Practice using these indicators in a demo or virtual trading account first. Over time, you will learn how to read their signals. You will also understand how they fit your own trading style.
How to Learn Each Indicator Step by Step
- Start with RSI – Learn how RSI is calculated and what overbought and oversold mean. Look at real stock charts to see RSI in action.
- Study MACD – Understand how the MACD line, signal line, and histogram work. Practice spotting crossovers on charts.
- Explore Bollinger Bands – See how the bands widen and narrow with volatility. Learn to spot when the price touches the upper or lower band.
- Combine All Three – Practice using RSI, MACD, and Bollinger Bands together to confirm your trades. Stronger signals come from multiple indicators.

Free Registration for Stock Market Tips ( Advisory Services)
As per the SEBI rules, we will provide our Services only to those clients who have Complete Risk Profile. Fill This Registration Form and
Contact us on
- Whatsapp @ +91 95999 69624
- Call Us @ +91 9650 890 321
for further process.
Risk Profiling is COMPULSORY
Bollinger Bands: How This Volatility Indicator Works in Trading
Bollinger Bands are a technical analysis tool that measures market volatility by plotting a set of three lines around a stock's moving average. The middle band is a 20-day simple moving average (SMA), while the upper and lower bands are set two standard deviations above and below that average. When volatility increases, the bands widen; when volatility decreases, they contract. Traders use these bands to identify overbought and oversold conditions, anticipate price breakouts, and gauge the strength of ongoing trends.
What do Bollinger Bands tell a trader?
Bollinger Bands show how far a stock price deviates from its average over a specific period. A price touching or exceeding the upper band suggests the stock may be overbought, while a price touching or falling below the lower band suggests it may be oversold. The bands also visually expand and contract with changes in volatility, helping traders decide when to enter or exit a position.
How are Bollinger Bands calculated?
The middle band is a 20-period simple moving average (SMA). The upper band is the middle band plus two times the standard deviation of the price data. The lower band is the middle band minus two times the standard deviation. Standard deviation is a statistical measure of price dispersion, so the bands automatically widen when price movement becomes more volatile and narrow when price movement stabilizes.
What is the best way to use Bollinger Bands with other indicators?
Bollinger Bands work best when combined with momentum indicators like RSI and MACD. For example, if the price touches the upper Bollinger Band and the RSI is above 70, both signals point toward an overbought condition. If the MACD shows a bearish crossover at the same time, the confirmation is stronger. Using multiple indicators helps filter out false signals.
Can Bollinger Bands predict price direction?
Bollinger Bands do not predict price direction on their own. They measure volatility and relative price levels within a statistical range. A common pattern is the "squeeze," where the bands contract tightly, indicating low volatility. This often precedes a sharp price move, but the bands alone do not indicate whether the move will be up or down. Traders must use other tools to determine direction.
- What does a Bollinger Band squeeze mean?
- A Bollinger Band squeeze occurs when the upper and lower bands move close together, indicating a period of low volatility. This often signals that a sharp price move may be coming soon.
- Should I buy when price touches the lower Bollinger Band?
- Touching the lower band alone is not a buy signal. It only means the price is statistically low relative to recent averages. Look for confirmation from other indicators like RSI or MACD before entering a trade.
- What time frame works best for Bollinger Bands?
- Bollinger Bands work on any time frame from 1-minute charts to daily and weekly charts. Shorter time frames produce more signals, while longer time frames produce fewer but often more reliable signals.
- Do Bollinger Bands work in all market conditions?
- Bollinger Bands are most effective in trending or range-bound markets. During periods of extremely low volatility or in highly manipulated markets, band-based signals may give false readings. Always consider broader market context.
- What is the difference between Bollinger Bands and Keltner Channels?
- Bollinger Bands use standard deviation to set band width, while Keltner Channels use average true range (ATR). Bollinger Bands react more to sudden price spikes because standard deviation is more sensitive to outliers.
- Can Bollinger Bands be used for options trading?
- Yes. Traders use Bollinger Bands to gauge implied volatility and identify potential support and resistance levels, which helps in choosing strike prices and expiration dates for options strategies.