

📈 Candlestick Patterns
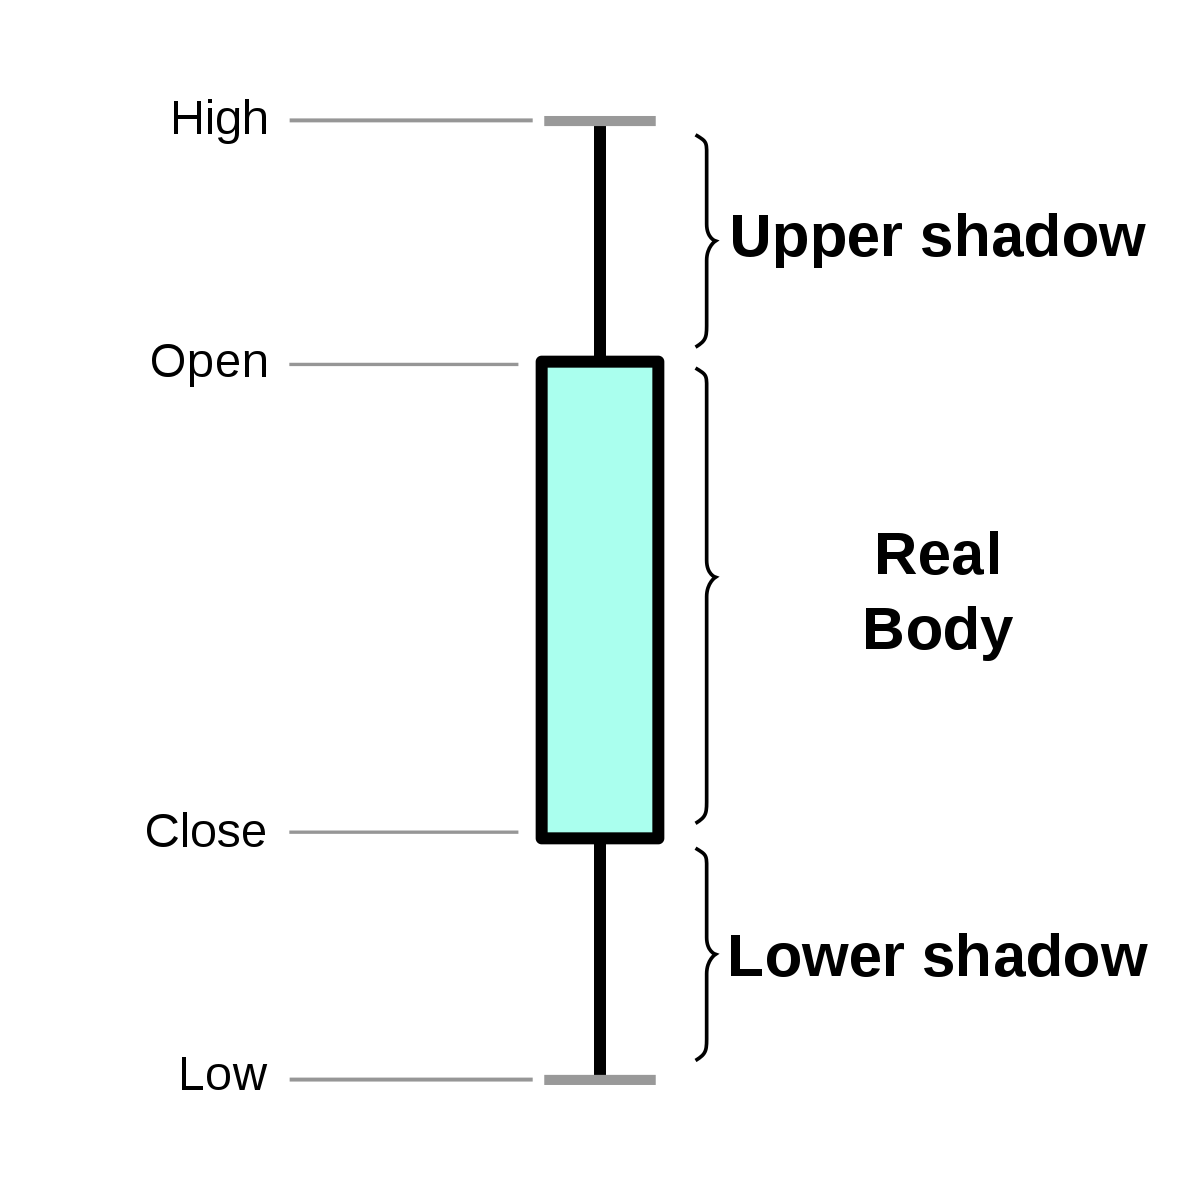
Candlestick patterns are a crucial part of technical analysis. These patterns provide insights into the psychology of market participants and can help predict future price movements. For example, the “Doji” candlestick pattern indicates indecision in the market and can signal a potential reversal.
import matplotlib.pyplot as plt
from mpl_finance import candlestick_ohlc
import pandas as pd
import datetime as dt

# Create a simple Doji candlestick pattern
data = pd.read_csv('stock_data.csv', index_col=0, parse_dates=True)
ohlc = data['Close'].resample('1D').ohlc()
ohlc.reset_index(inplace=True)
ohlc['Date'] = ohlc['Date'].map(dt.date2num)

fig, ax = plt.subplots()
candlestick_ohlc(ax, ohlc.values, width=0.6, colorup='g', colordown='r')
plt.show()
Fibonacci Retracement Levels

Fibonacci retracement levels are used to identify potential support and resistance levels based on the Fibonacci sequence. Traders use these levels to anticipate price reversals and plan their entry and exit points. For instance, the 61.8% retracement level is often considered a key level where price reversals may occur.
// Calculate Fibonacci retracement levels
const high = 100;
const low = 50;
const retracement_61_8 = high - ((high - low) * 0.618);
console.log(`61.8% retracement level: ${retracement_61_8}`);
Moving Averages and MACD
Moving averages and the Moving Average Convergence Divergence (MACD) are widely used technical indicators. They help traders identify trends, momentum, and potential entry or exit points. For example, a bullish crossover of the MACD line above the signal line is considered a buy signal.
import pandas as pd
import matplotlib.pyplot as plt

# Calculate 50-day and 200-day moving averages
data = pd.read_csv('stock_data.csv', index_col=0, parse_dates=True)
data['MA_50'] = data['Close'].rolling(window=50).mean()
data['MA_200'] = data['Close'].rolling(window=200).mean()

# Plot the moving averages
plt.figure(figsize=(12, 6))
plt.plot(data['Close'], label='Close Price')
plt.plot(data['MA_50'], label='50-day MA')
plt.plot(data['MA_200'], label='200-day MA')
plt.legend()
plt.show()
Relative Strength Index (RSI)
The RSI is a momentum oscillator that measures the speed and change of price movements. It oscillates between 0 and 100 and is used to identify overbought or oversold conditions in the market. A reading above 70 is typically considered overbought, while a reading below 30 is considered oversold.
// Calculate RSI
const prices = [60, 62, 65, 63, 68, 70, 72, 75, 80, 78, 82, 85, 88, 90];
const periods = 14;
let avgGain = 0;
let avgLoss = 0;

for (let i = 1; i < periods; i++) {
  const change = prices[i] - prices[i - 1];
  if (change > 0) {
    avgGain += change;
  } else {
    avgLoss -= change;
  }
}

avgGain /= periods;
avgLoss /= periods;

const RS = avgGain / avgLoss;
const RSI = 100 - (100 / (1 + RS));
console.log(`RSI: ${RSI}`);
Bollinger Bands
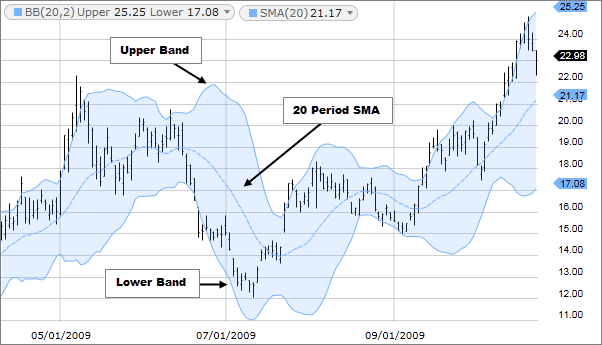
Bollinger Bands consist of a middle band (simple moving average) and two outer bands that are standard deviations away from the middle band. They are used to measure volatility and identify potential overbought or oversold conditions. When the price touches the upper band, it may indicate overbought conditions, while touching the lower band may indicate oversold conditions.
import pandas as pd
import matplotlib.pyplot as plt

# Calculate Bollinger Bands
data = pd.read_csv('stock_data.csv', index_col=0, parse_dates=True)
data['20MA'] = data['Close'].rolling(window=20).mean()
data['20SD'] = data['Close'].rolling(window=20).std()
data['UpperBand'] = data['20MA'] + (2 * data['20SD'])
data['LowerBand'] = data['20MA'] - (2 * data['20SD'])

# Plot the Bollinger Bands
plt.figure(figsize=(12, 6))
plt.plot(data['Close'], label='Close Price')
plt.plot(data['20MA'], label='20-day MA')
plt.plot(data['UpperBand'], label='Upper Band')
plt.plot(data['LowerBand'], label='Lower Band')
plt.legend()
plt.show()
By mastering these technical analysis tools, investors can gain a deeper understanding of market dynamics and make informed decisions when engaging in short-term stock market investments.
To do: Practice using a specific technical analysis tool for short-term stock market investments.
Short step-by-step plan:
Choose a technical analysis tool: Select a popular tool such as moving averages, relative strength index (RSI), or Bollinger Bands.
Example: Choose to practice using the RSI indicator for identifying overbought and oversold conditions in stock prices.
Study the tool: Understand how the chosen tool works and its interpretation in stock market analysis.
Example: Research the RSI indicator to learn how it measures the speed and change of price movements, and how it can indicate potential trend reversals.
Find historical stock data: Obtain historical stock price data for a specific stock or market index to apply the chosen tool.
Example: Download historical price data for a selected stock from the past year.
Apply the tool: Use the historical stock data to practice applying the chosen technical analysis tool and interpreting its signals.
Example: Calculate the RSI values for the historical price data and identify instances of overbought and oversold conditions.
Evaluate the results: Analyze the effectiveness of the tool in identifying potential short-term investment opportunities.
Example: Assess the accuracy of the RSI indicator in predicting short-term price movements and make notes on its performance.
Repeat and refine: Practice applying the chosen tool to different stocks and time periods to gain proficiency and refine your understanding.
Example: Apply the RSI indicator to multiple stocks and compare its performance in different market conditions.


