


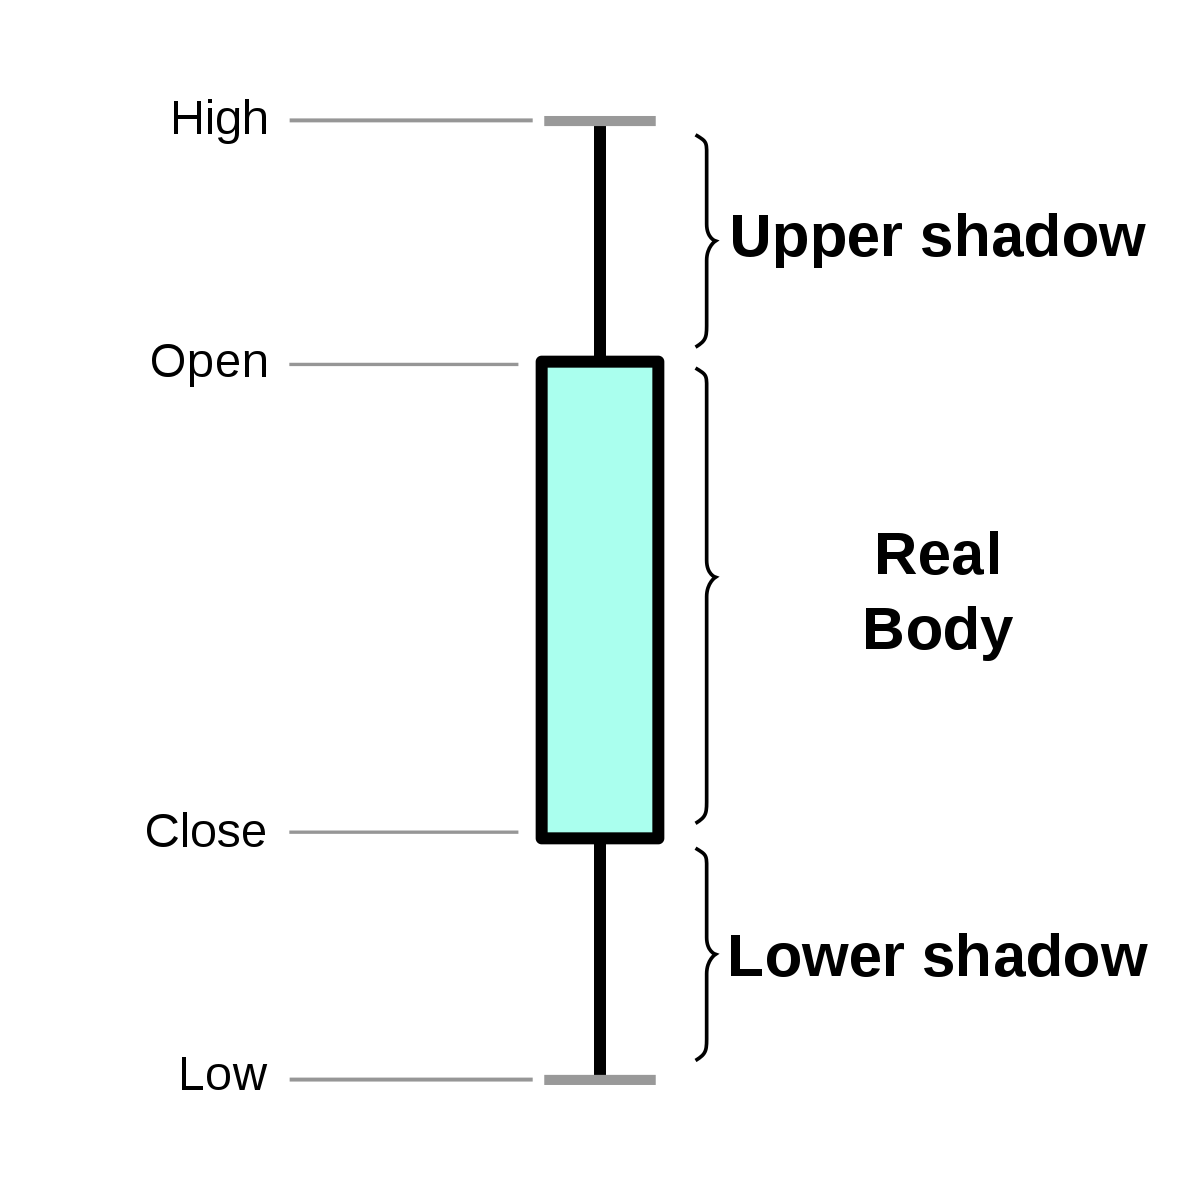
Understanding Candlestick Patterns
Learn about the different candlestick patterns and how they help predict price movements in the stock market.


Identifying Support and Resistance Levels
Learn how to identify support and resistance levels on stock charts and understand how they affect your trading decisions.
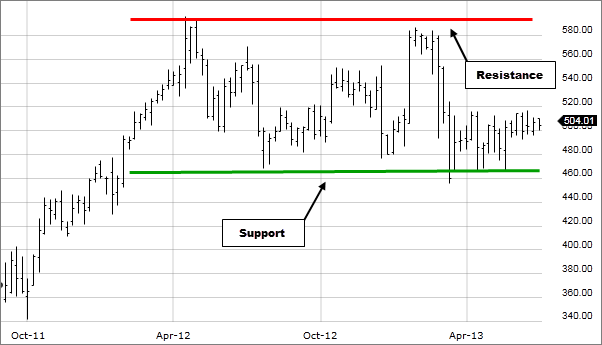
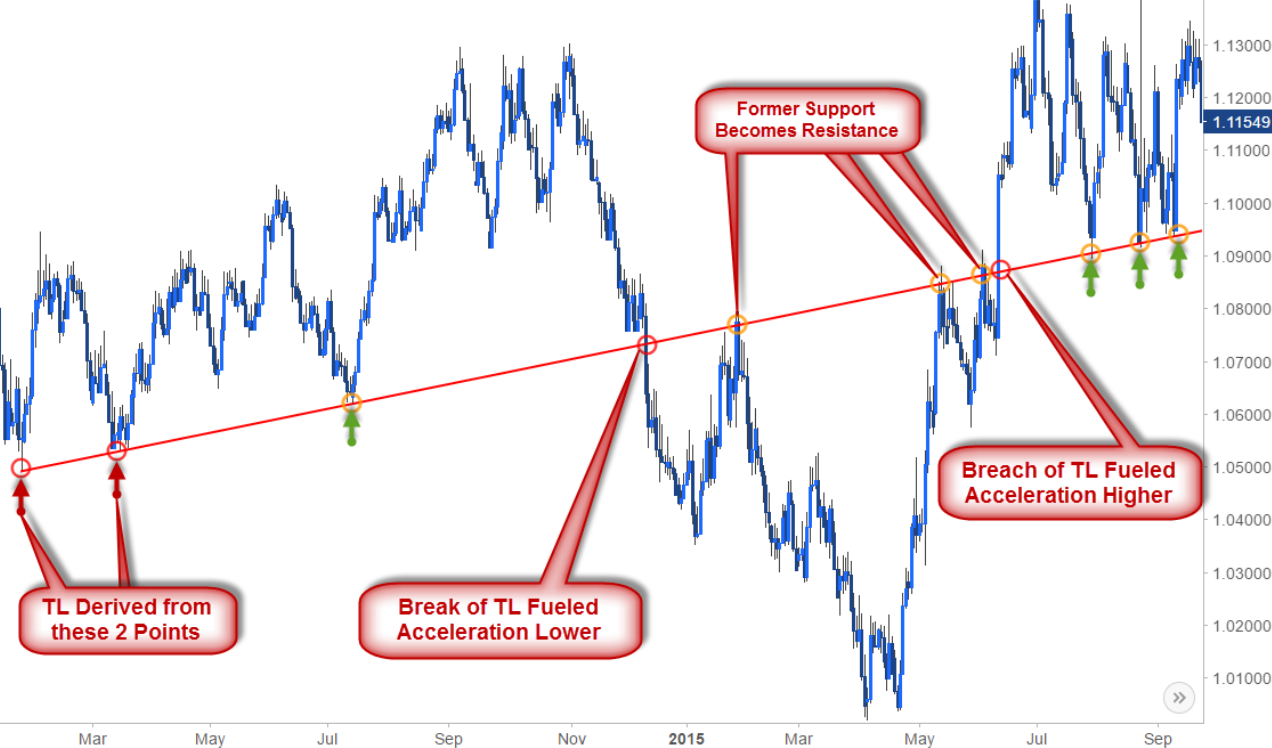
Key Support and Resistance Levels on Stock Charts
Support and resistance levels are like the psychological barriers of the stock market. They represent the prices at which a stock often reverses its direction.
How Support and Resistance Impact Trading Decisions
Support and resistance levels are like the psychological barriers of the stock market. They represent the points on a chart where the price of a stock tends to reverse its direction.

Apply Support and Resistance to Real Market Scenarios
Support and resistance levels are like the floor and ceiling of a room in the stock market. Support is the price level where a stock tends to stop falling because buyers step in, while Resistance is where it often stops rising due to selling pressure.

How to Use Moving Averages in Trading
Understand how moving averages help you analyze trends and find good entry and exit points for trades.

What Are Moving Averages and How Are They Calculated
Moving averages are essential tools for traders and analysts to understand and utilize. They help in identifying trends, potential entry and exit points, and can even serve as support and resistance levels.

Types of Moving Averages: SMA and EMA
such as the simple moving average (SMA) and exponential moving average (EMA). Moving averages are like a compass for traders, helping them navigate market ups and downs.
Using Moving Averages for Entry and Exit Points
Moving averages are one of the most popular tools used by traders and investors to smooth out price data over a specified period of time.
Popular Technical Indicators: RSI, MACD, and Bollinger Bands
Explore popular technical indicators like RSI, MACD, and Bollinger Bands. Learn how to use them in stock market analysis.

How to Calculate and Interpret Technical Indicators
like RSI, MACD, and Bollinger Bands.

Applying RSI, MACD, and Bollinger Bands in Stock Analysis
The RSI is a momentum oscillator that measures the speed and change of price movements.

Using RSI, MACD, and Bollinger Bands for Buy and Sell Signals
Technical indicators are essential tools for traders looking to navigate the stock market.

Recognizing Chart Patterns: Head and Shoulders, Triangles, and Flags
Learn to spot chart patterns like head and shoulders, triangles, and flags to predict future price movements.
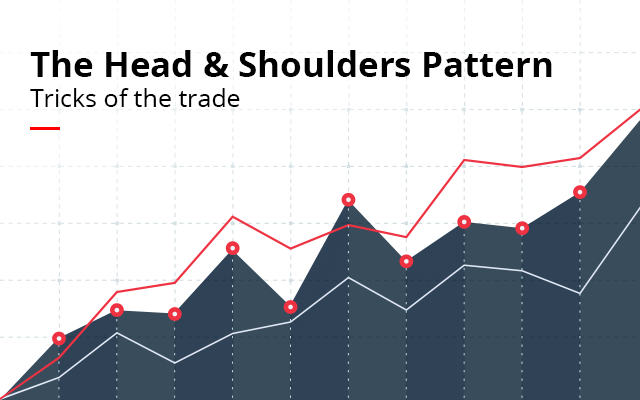
Head and Shoulders Pattern
Which indicates a potential trend reversal

Triangle patterns
Which suggest a continuation of the current trend

Flag Patterns and Trend Continuation
Flag patterns signal that a trend is likely to keep going.

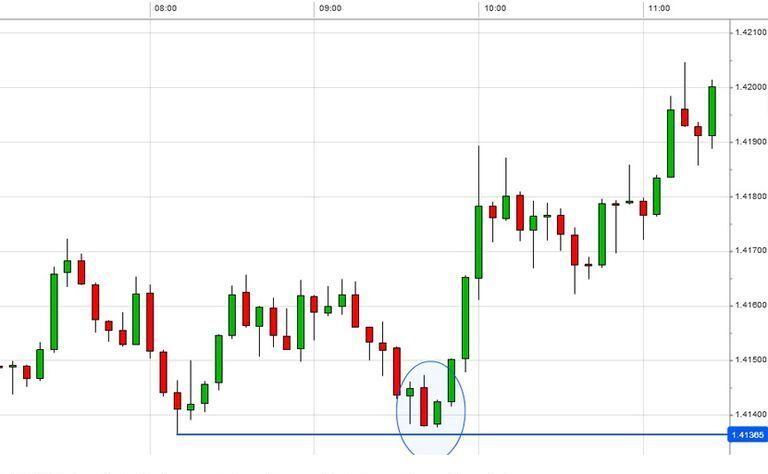
Understanding Volume Analysis in Trading
Find out how trading volume confirms price trends and helps you spot potential reversals.

How Trading Volume and Price Movements Are Related
Trading volume represents the total number of shares or contracts traded for a particular asset within a given time frame.

Why Rising Volume Confirms Price Trends
Volume in trading refers to the number of shares or contracts traded in a security or an entire market during a given period.

How Volume Helps Identify Market Reversals
Understanding volume's role in the market can greatly enhance your trading strategy and help you anticipate potential reversals before they happen.

Risk Management for Smarter Trading
Learn how to manage risk with position sizing, stop-loss orders, and risk-reward ratios.

How Position Sizing Affects Risk Management
Position sizing should not be used in isolation. It's part of a broader risk management strategy that includes stop-loss orders, risk-reward ratios, and ongoing market analysis.

How to Set Stop-Loss Orders to Limit Losses
Stop-loss orders are a critical component of a sound risk management strategy. They help traders control potential losses, protect profits, and provide peace of mind in volatile markets.

Using Risk-Reward Ratios to Improve Your Trading
Risk-reward ratios are crucial in trading as they help you determine the potential profit for every dollar you risk. A common risk-reward ratio is 1:3, meaning you're aiming to make three times what you're risking.