The Head And Shoulders Pattern

Which Indicates A Potential Trend Reversal.

How the Head and Shoulders Pattern Signals a Trend Reversal


📈 The Anatomy of a Head and Shoulders Pattern

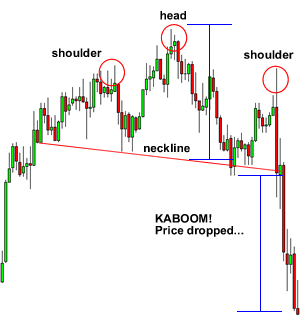
The Head and Shoulders pattern is a chart formation that resembles a baseline with three peaks; the outside two are close in height, and the middle is highest. It is typically formed in an uptrend and signals that the asset’s price is set to fall. The opposite is the inverse head and shoulders, which forms during a downtrend and signals a potential upward move.

  • Left Shoulder: Occurs during the uptrend, prices peak and then fall to a new support level.

  • Head: After reaching the new support, prices rise again forming a higher peak before falling back to the support level.

  • Right Shoulder: Prices rise for the last time but not as high as the head before falling back to the support, completing the pattern.

🔍 Identifying the Pattern in Real-Time

head and shoulder pattern

  1. Uptrend Recognition: Spot an existing uptrend. The head and shoulders pattern does not form in a downtrend.

  2. Peak Formation: Watch for a peak to form and then retrace back to a support level, forming the left shoulder.

  3. New High: Look for the price to reach a higher peak before falling back to the support level, creating the head.

  4. Lower High Formation: Identify a third peak that does not surpass the height of the head, forming the right shoulder.

  5. Neckline: Draw a line connecting the low points of the two troughs from the left shoulder and head. This is the neckline, a critical support level.

📊 Example of a Head and Shoulders Pattern

Left Shoulder: Stock X rises to $50, retraces to $40.\nHead: Stock X ascends to $60, declines back to $40.\nRight Shoulder: Stock X climbs to $55, then falls to $40.\nNeckline: A straight line drawn at the $40 support level.\n

How to Confirm the Head and Shoulders Pattern

  • Volume: Ideally, volume should decrease as the pattern forms, with the right shoulder having less volume than the left.

  • Neckline Break: A decisive close below the neckline confirms the pattern.

  • Price Target: After the breakout, the price target is typically the distance from the head’s peak to the neckline projected downward.

📉 The Head and Shoulders Pattern in Market History

Before major market downturns, many stocks have formed the head and shoulders pattern. During the early 2000s tech downturn, several companies showed this classic reversal formation. After the right shoulder formed and the price broke below the neckline, stocks dropped significantly.

Similarly, before the 2008 financial crisis, many bank stocks displayed head and shoulders patterns. These formations served as early warning signals for traders who were watching for trend reversals.

🔄 Inverse Head and Shoulders: A Bullish Signal

Just as the traditional head and shoulders pattern signals a bearish reversal, the inverse head and shoulders pattern indicates a bullish reversal during a downtrend.

  • Formation: It’s the mirror image with the head forming a lower low and the shoulders forming higher lows.

  • Breakout: A break above the neckline suggests a potential upward price movement.

🛠️ Tools for Practicing Pattern Recognition

  • Charting Software: Use platforms with drawing tools to manually identify patterns.

  • Historical Data: Study past charts from periods of market volatility to see how the patterns played out.

  • Paper Trading: Practice recognizing patterns and making trades without risking real money.

Understanding chart patterns like the head and shoulders can help you anticipate future price movements. For the best results, use this pattern along with other forms of technical analysis. No single pattern works perfectly every time.

Tips for Trading the Head and Shoulders Pattern:

  • Wait for the right shoulder to finish forming before you make a trade.

  • Watch for the neckline break. A close below the neckline confirms the pattern.

  • Check the volume. Lower volume on the right shoulder makes the signal stronger.

  • Set a price target. Measure from the head down to the neckline. Project that same distance below the neckline.

  • Use a stop-loss. Place it above the right shoulder to limit your risk.

best bank nifty option tips provider in india

Free Registration for Stock Market Tips ( Advisory Services)

As per the SEBI rules, we will provide our Services only to those clients who have Complete Risk Profile. Fill This Registration Form  and 
Contact us on

  • Whatsapp @ +91 95999 69624
  • Call Us @ +91 9650 890 321 
    for  further process.

Risk Profiling is COMPULSORY

Head and Shoulders Pattern: Definition, Identification, and Trading Rules

The head and shoulders pattern is a technical chart formation used in financial markets to predict a trend reversal from bullish to bearish. It consists of three peaks — a left shoulder, a higher head, and a right shoulder — with a neckline drawn across the two troughs between them. A confirmed breakdown below the neckline signals that the prior uptrend has ended and a downtrend is likely underway. The pattern is one of the most widely recognized reversal formations in technical analysis and is used by traders across stocks, forex, commodities, and cryptocurrencies.

What does a head and shoulders pattern look like on a chart?

A head and shoulders pattern visually resembles a person's head with two shoulders. It forms after an uptrend when prices create a peak (left shoulder), retrace, climb to a higher peak (head), retrace again, and then rise to a lower peak (right shoulder) before falling through the neckline. The three peaks create a shape with a higher middle peak flanked by two shorter peaks of roughly equal height.

How do you confirm a head and shoulders pattern?

Confirmation requires three conditions. First, volume typically declines as the pattern develops, with the right shoulder showing lower volume than the left shoulder. Second, the price must break decisively below the neckline — a close below the neckline is a stronger confirmation than an intraday break. Third, after the break, the neckline often acts as new resistance, and a retest of the neckline from below can further validate the breakdown.

What is the price target for a head and shoulders pattern?

The measured price target is calculated by taking the vertical distance from the head's peak down to the neckline and projecting that same distance downward from the neckline break point. For example, if the head peaks at $60 and the neckline is at $40, the distance is $20, so the target is $20 below the neckline at $20. This target is an estimate, not a guarantee, and traders often take partial profits before the target is reached.

Can the head and shoulders pattern fail?

Yes, the head and shoulders pattern can produce false signals. A pattern fails if the price breaks below the neckline but quickly reverses back above it, a move known as a false breakdown or bull trap. Failure rates are higher in low-volume conditions and during choppy, sideways markets. Using volume confirmation and waiting for a decisive close below the neckline helps reduce the risk of acting on a failed pattern.

What is the difference between head and shoulders and inverse head and shoulders?

The traditional head and shoulders pattern forms at market tops and signals a bearish reversal. The inverse head and shoulders pattern forms at market bottoms and signals a bullish reversal. In the inverse version, the pattern is inverted — the left shoulder, head, and right shoulder are troughs (lows) rather than peaks, and a breakout above the neckline confirms the upward reversal. The inverse head and shoulders is a mirror image of the standard pattern.

How reliable is the head and shoulders pattern for trading?

The head and shoulders pattern is considered one of the more reliable reversal patterns in technical analysis, but its accuracy depends on market context, time frame, and confirmation signals. Studies of historical price data show that the pattern performs best on daily and weekly charts, in liquid markets, and when accompanied by declining volume through the pattern and a spike in volume at the neckline break. Like all chart patterns, it should be used alongside other technical tools such as trendlines, support and resistance levels, and momentum indicators.

What causes a head and shoulders pattern to form?
A head and shoulders pattern forms when buying momentum gradually weakens after a prolonged uptrend. The left shoulder represents the last strong push higher, the head shows a final surge that fails to sustain, and the right shoulder reflects even weaker buying interest as sellers take control, leading to the breakdown.
Which time frames work best for spotting head and shoulders patterns?
The pattern is most reliable on higher time frames such as daily and weekly charts. On shorter time frames like 1-minute or 5-minute charts, the pattern produces more false signals due to market noise.
Does the head and shoulders pattern work in crypto markets?
Yes, the head and shoulders pattern applies to any freely traded market, including cryptocurrencies. The same rules for identification, volume confirmation, and neckline break apply across stocks, forex, commodities, and crypto assets.
How do you set a stop-loss when trading a head and shoulders breakout?
A common stop-loss placement is above the right shoulder or above the most recent swing high before the breakdown. This placement gives the trade room to breathe while capping the loss if the pattern fails and price reverses back above the neckline.
Scroll to Top