Identify Different Types Of Moving Averages Such As Simple Moving Average (SMA) And Exponential Moving Average (EMA)
Types of Moving Averages: SMA vs EMA Explained

Moving averages help traders spot trends and find good entry and exit points. The two main types of moving averages are the Simple Moving Average (SMA) and the Exponential Moving Average (EMA). Each one reacts to price changes in its own way, and knowing the difference can help you trade with more confidence.
🌟 Simple Moving Average (SMA)

The Simple Moving Average (SMA) is the most straightforward type of moving average. It is calculated by taking the average of a set of prices over a specific number of periods. For example:
SMA = (P1 + P2 + P3 + ... + Pn) / n
Where P1, P2, P3, ... Pn are the prices in each period and n is the number of periods.
Example: If you are looking at a 10-day SMA, add up the closing prices of the last 10 days and divide by 10.
Real Story: Apple’s stock price has historically bounced off its 200-day SMA several times. This gave many traders reliable entry points.
🌟 Exponential Moving Average (EMA)

The Exponential Moving Average (EMA) gives more weight to recent prices. This makes it more responsive to new information. The formula uses the previous period’s EMA:
EMA = (Current Price - Previous EMA) * (2 / (n + 1)) + Previous EMA
Example: If the previous 10-day EMA was 150 and the current price is 155, the new EMA will be slightly higher. This shows the recent price increase.
Real Story: During sharp market downturns, the EMA on the S&P 500 has quickly shown the direction of the move. It signaled traders to change their strategies much faster than the SMA.
🌟 Comparing SMA and EMA

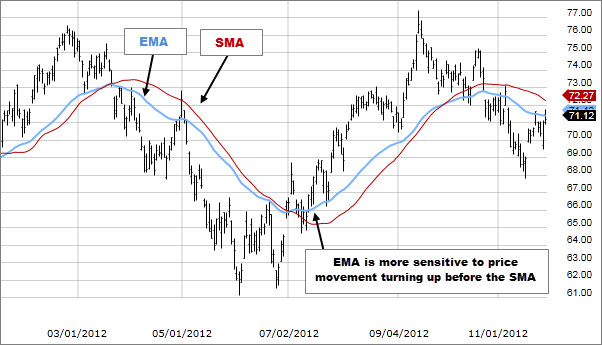
Both SMA and EMA help smooth out price data and identify trends. The main difference is sensitivity. SMA is less sensitive and lags behind trend changes. EMA is more sensitive and stays closer to the price, showing changes more quickly.
Example: A 50-day SMA might show a trend reversal several days after it happens. A 50-day EMA could show it almost right away.
Real Story: Bitcoin is known for its sharp price swings. An EMA could have given traders an early signal to exit before a major drop. The SMA lagged behind, which may have led to bigger losses for those who only used it.
🌟 Using Moving Averages for Entry and Exit Points

Analyzing trends with moving averages can help traders find good entry and exit points. When the price crosses above a moving average, it may be a bullish signal. When it crosses below, it may be a bearish signal.
Example: If a stock price crosses above its 20-day EMA after a period of consolidation, a trader might see this as a sign to buy.
Real Story: When Amazon’s stock price crossed above its 50-day EMA, it was a signal for many investors to enter. Those who did benefited from the strong uptrend that followed.
Using different types of moving averages can improve your market analysis. Whether you like the simplicity of the SMA or the speed of the EMA, both can give useful insights into trends and trading opportunities. No indicator works perfectly every time, so it is smart to use moving averages with other tools and your own analysis.
Quick guide to moving averages:
- What are moving averages? A tool that smooths out price data to help spot trends. SMA gives equal weight to all prices. EMA gives more weight to recent prices.
- Simple Moving Average (SMA): Add up closing prices over a set number of periods, then divide by that number. Example: A 10-day SMA adds the last 10 closing prices and divides by 10.
- Exponential Moving Average (EMA): Uses a multiplier to give more weight to recent prices. Example: For a 10-day EMA, the multiplier is 0.1818 (2 divided by 10+1).
- SMA vs EMA: SMA is slower and smoother. EMA is faster and more sensitive to recent price changes.
- How traders use them: When a short-term moving average crosses above a long-term one, it can be a buy signal. A cross below can be a sell signal.
Types of Moving Averages Explained: SMA, EMA, and How They Differ
The two main types of moving averages used in technical analysis are the Simple Moving Average (SMA) and the Exponential Moving Average (EMA). A moving average is a lagging technical indicator that smooths price data over a specified period to help traders identify the direction of a trend. The SMA calculates the arithmetic mean of prices over a set number of periods, giving equal weight to each data point. The EMA places greater weight on the most recent prices, making it more responsive to new information. A third type, the Weighted Moving Average (WMA), also assigns more weight to recent data but uses a linear weighting method rather than the exponential formula used by the EMA.
What are the main types of moving averages?
The three most common types of moving averages are the Simple Moving Average (SMA), the Exponential Moving Average (EMA), and the Weighted Moving Average (WMA). The SMA is the simplest and smoothest, the EMA reacts fastest to price changes, and the WMA falls between them in responsiveness.
How is a Simple Moving Average (SMA) calculated?
The SMA is calculated by adding together the closing prices over a chosen number of periods and dividing that total by the number of periods. For example, a 10-day SMA adds the closing prices of the last 10 days and divides the sum by 10. Each price in the calculation carries the same weight.
How is an Exponential Moving Average (EMA) different from an SMA?
The EMA applies a multiplier to give greater weight to recent prices, while the SMA treats every price equally. This makes the EMA react faster to new price action and stay closer to current market prices, whereas the SMA lags further behind and produces a smoother line with fewer false signals.
What is a Weighted Moving Average (WMA)?
A Weighted Moving Average (WMA) assigns a linearly increasing weight to each price point, with the most recent price receiving the highest weight. Unlike the EMA which uses an exponential multiplier, the WMA weight declines in a straight line from newest to oldest data point.
Which type of moving average is best for short-term trading?
The EMA is generally preferred for short-term trading because its faster reaction to price changes helps traders spot entry and exit signals sooner. Day traders and swing traders often use shorter-period EMAs such as the 9-day, 12-day, or 20-day EMA to capture quick moves.
How do traders choose between SMA and EMA?
Traders choose based on their strategy and time frame. Swing traders and long-term investors tend to prefer the SMA for its smoother, more stable signals that filter out noise. Short-term and active traders typically favor the EMA for its quicker responsiveness to price changes and trend reversals.
- What are the different types of moving averages?
- The three main types of moving averages are the Simple Moving Average (SMA), the Exponential Moving Average (EMA), and the Weighted Moving Average (WMA). Each type differs in how it weights price data over time.
- What is the difference between SMA and EMA?
- The SMA gives equal weight to every price in the calculation period, creating a smoother line. The EMA gives more weight to recent prices, making it more sensitive to current market conditions.
- Which moving average is more accurate, SMA or EMA?
- Neither is inherently more accurate. The SMA is better at showing long-term trends with less noise, while the EMA is better at detecting trend changes quickly. The right choice depends on the trader's time horizon and strategy.
- What is the best moving average period for day trading?
- Day traders commonly use short periods such as the 9-day, 12-day, or 20-day EMA. Shorter periods react faster to price changes, which suits the fast pace of intraday trading.
- Can you use SMA and EMA together?
- Yes, many traders plot both SMA and EMA lines on the same chart. The SMA provides a broader view of the overall trend, while the EMA gives earlier signals about potential reversals or breakouts.
- What is the difference between WMA and EMA?
- The WMA uses a linear weighting scheme where weights decline evenly from newest to oldest price. The EMA uses an exponential multiplier that gives proportionally heavier weight to the most recent prices, making it slightly more responsive than the WMA.