

What Are Chart Patterns in Technical Analysis?
Chart patterns are recognizable formations that develop on price charts as buyers and sellers interact in the market. Traders use these patterns in technical analysis to study price behaviour and identify potential trend continuation, reversal and breakout opportunities.
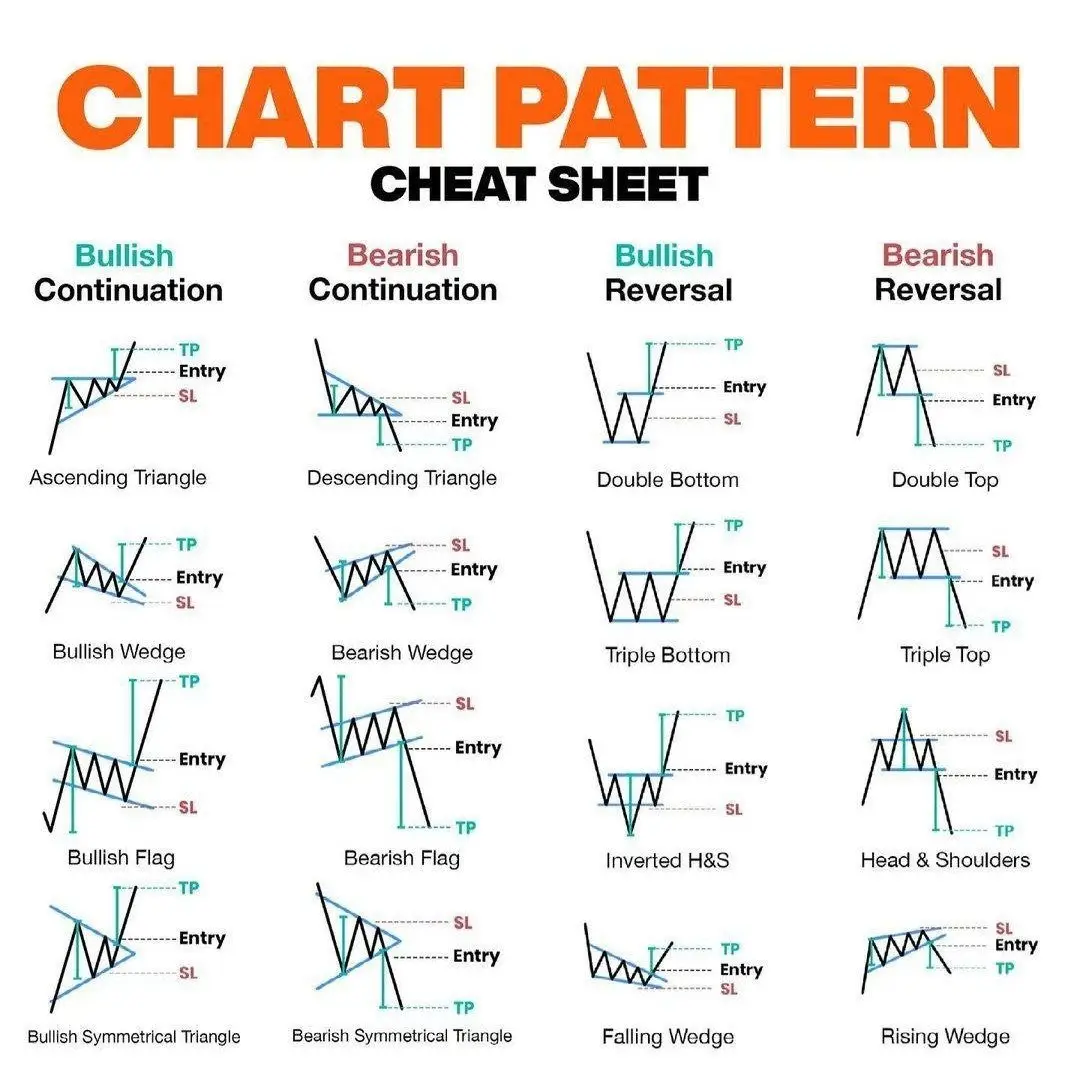
Some chart patterns, such as the Head and Shoulders pattern, are commonly associated with potential trend reversals. Others, including triangle patterns, flags and pennants, can develop while the market is consolidating before its next significant move.
However, a chart pattern should not be treated as a guaranteed trading signal. Traders generally look for confirmation through factors such as breakouts, support and resistance levels, trading volume and overall market trend before making a trading decision.
📈 Head and Shoulders Pattern: Identifying a Market Reversal
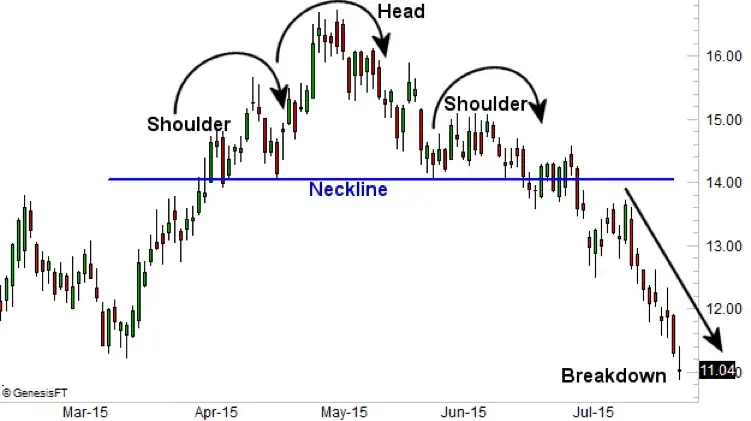
A Head and Shoulders pattern is generally considered more meaningful when price breaks below the neckline after forming the right shoulder. Traders may also watch trading volume, the strength of the breakdown and the broader market trend before treating the formation as a potential reversal signal.
The pattern itself does not guarantee that the previous trend will reverse. A failed neckline breakdown or quick price recovery can result in a false signal.
Example:Left Shoulder: Price rises to a peak and then declines. Head: Price rises again to form a higher peak, followed by another decline. Right Shoulder: Price rises again but forms a lower peak than the head before declining. Neckline: A support line drawn by connecting the two troughs between the left shoulder, head, and right shoulder.
Confirmation: The Head and Shoulders pattern is generally considered confirmed when price breaks below the neckline. Traders may also look at trading volume and the strength of the breakdown for additional confirmation.
🔺 Triangle Chart Patterns: Ascending, Descending and Symmetrical
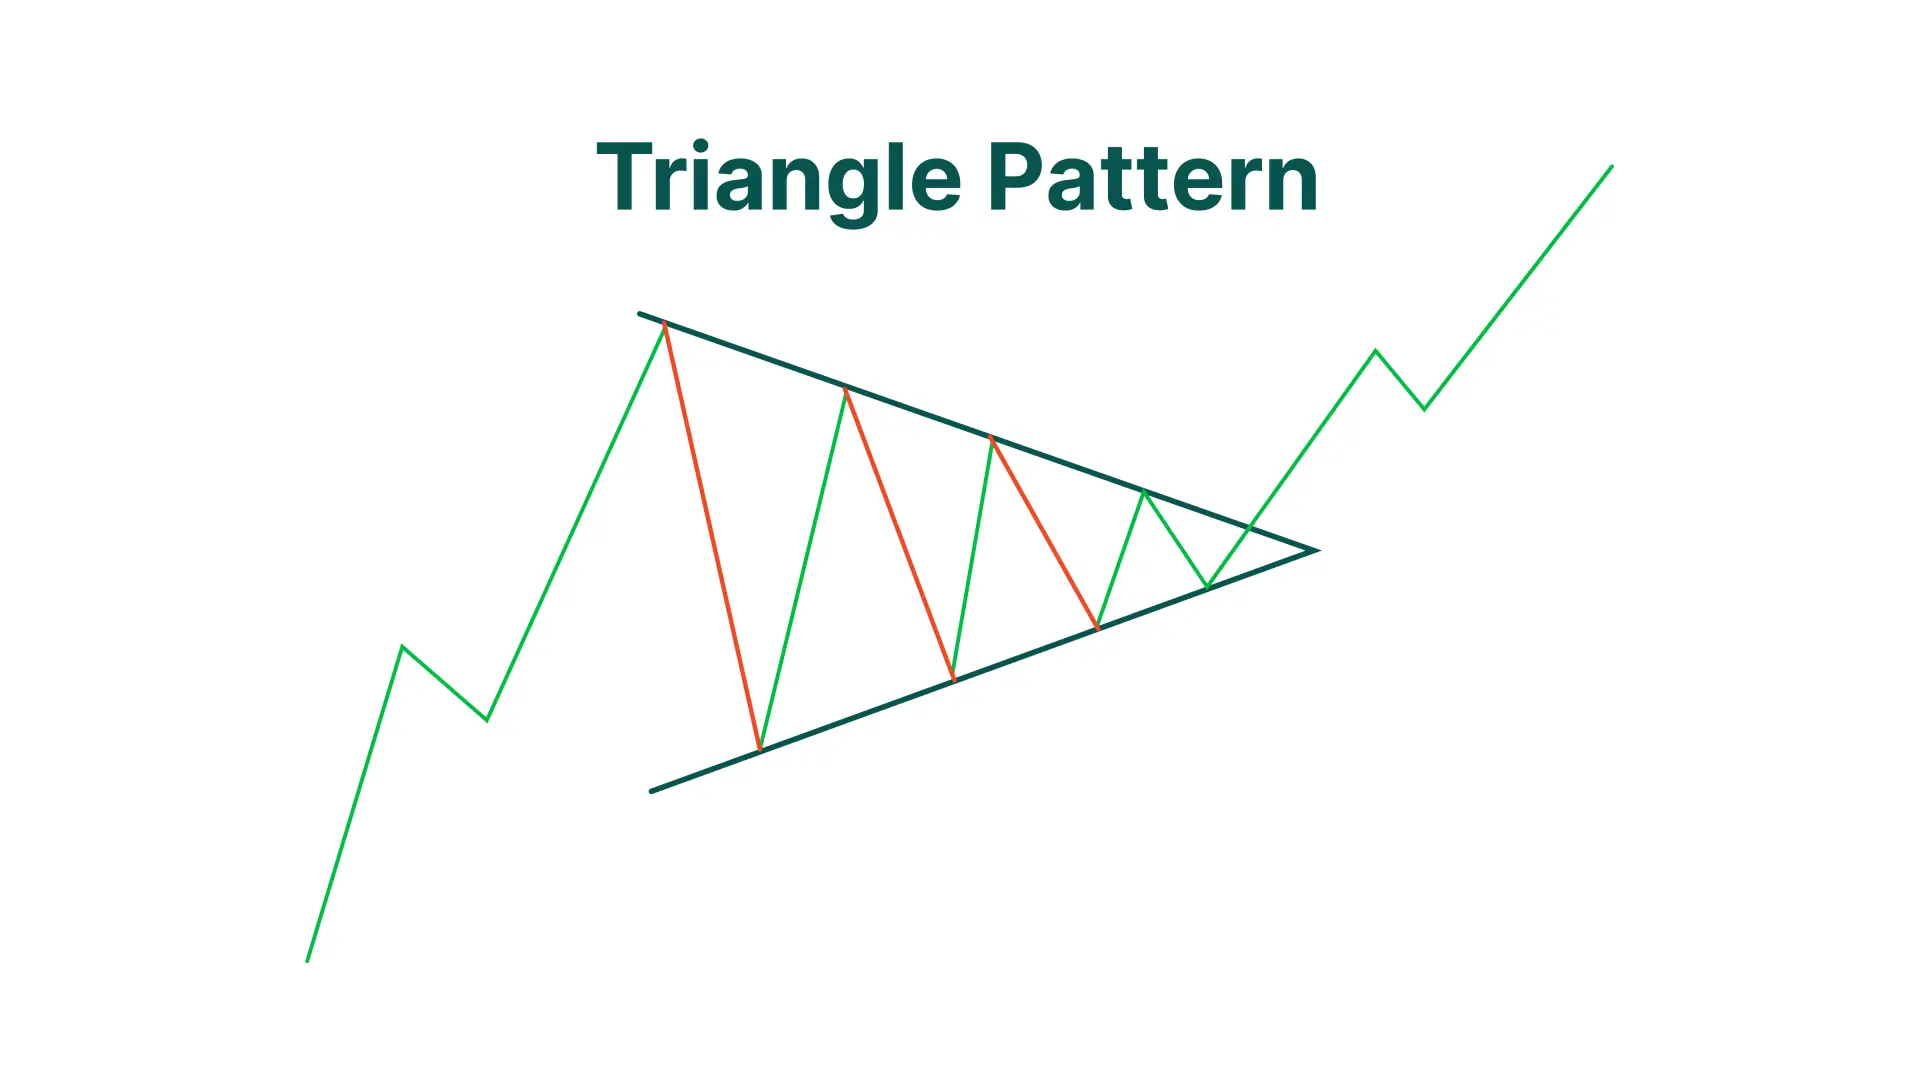
Triangles are continuation patterns that can signal consolidation before a breakout.
Ascending Triangle Pattern
This pattern features a flat top and an ascending lower line. Bulls are pushing the price up against a resistance level, which could lead to an upward breakout.
Descending Triangle Pattern
Here, there’s a flat bottom with a descending upper line. Bears are forcing the price down to a support level, indicating a potential downward breakout.
Symmetrical Triangle Pattern
Symmetrical triangles have converging upper and lower lines. They show a period of uncertainty where the breakout direction is unknown until it happens.
Real Story:
In September 2020, Banknifty formed a symmetrical triangle, causing traders to watch closely. The eventual breakout was upwards, leading to a significant price rally.
🚩 Flag and Pennant Chart Patterns in Trading
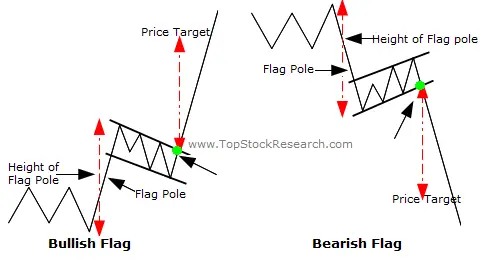
Flags and pennants are short-term chart patterns that can appear after a strong price movement. They are generally studied as potential continuation patterns because price temporarily consolidates before traders watch for a possible continuation of the previous trend.
Bull Flag Pattern
A bull flag looks like a downward sloping rectangle and is typically seen in an uptrend. It suggests that the uptrend will likely continue after the consolidation.
Bear Flag Pattern
The bear flag is an upward sloping rectangle during a downtrend, indicating that the downtrend may resume post-consolidation.
Pennant Chart Pattern
Similar to flags but smaller, pennants are small symmetrical triangles that form as the price consolidates briefly. They suggest continuation in the direction of the prevailing trend.
Example:
In November 2021, Banknifty options saw a bull flag pattern after a strong uptrend. Traders who recognized this pattern could have anticipated the continuation of the uptrend.
By understanding and recognizing these chart patterns, traders can make more informed decisions in Banknifty options trading. Remember, while patterns can indicate probable outcomes, they are not guarantees. Always use them in conjunction with other technical analysis tools and proper risk management strategies.
How to Identify Chart Patterns Step by Step:
- Identify the prevailing market trend.
- Look for a recognizable price formation.
- Mark important support, resistance, trendlines or neckline levels.
- Wait for the pattern structure to develop.
- Watch for a breakout or breakdown.
- Look for additional confirmation where appropriate.
- Define the potential entry, exit and risk levels before taking a trade.
Types of Chart Patterns: Reversal vs Continuation
Chart patterns can broadly be studied according to what they may indicate about the existing trend. Some patterns are associated with potential reversals, while others are commonly watched for trend continuation.
| Chart Pattern | Pattern Type | Usually Appears | Traders Watch For |
|---|---|---|---|
| Head and Shoulders | Reversal | After an uptrend | Neckline breakdown |
| Inverse Head and Shoulders | Reversal | After a downtrend | Neckline breakout |
| Ascending Triangle | Often continuation | During consolidation | Resistance breakout |
| Descending Triangle | Often continuation | During consolidation | Support breakdown |
| Symmetrical Triangle | Direction depends on breakout | During consolidation | Breakout direction |
| Bull Flag | Continuation | After a strong upward move | Break above flag |
| Bear Flag | Continuation | After a strong downward move | Break below flag |
| Pennant | Continuation | After a sharp price move | Breakout from consolidation |
How to Confirm a Chart Pattern Before Trading
Identifying a chart pattern is only the first step. Traders generally look for additional confirmation before acting on a potential breakout or reversal.
- Breakout or Breakdown: Wait for price to move beyond an important support, resistance, neckline or pattern boundary.
- Trading Volume: Changes in volume can help traders assess participation behind a breakout.
- Candle Close: Some traders wait for a candle to close beyond the breakout level rather than reacting to a temporary price move.
- Overall Trend: A pattern should be considered in the context of the broader market trend.
- Support and Resistance: Nearby support or resistance levels can affect how much room price has to move.
- Technical Indicators: Moving averages, RSI and other indicators may provide additional context, but they should not be treated as guarantees.
Chart Pattern Breakouts, Targets and Stop Loss
Once a chart pattern develops, traders generally focus on three areas: the breakout level, potential price objective and risk level.
Breakout Level
The breakout level is the price area where the market moves beyond an important boundary of the pattern. Depending on the pattern, this could be a neckline, resistance level, support level or trendline.
Price Target
Some chart patterns allow traders to estimate a potential price objective by measuring part of the pattern and projecting that distance from the breakout area. Such targets are estimates rather than guaranteed outcomes.
Stop Loss
A stop loss may be placed at a level where the original chart pattern setup would be considered invalid. The appropriate level depends on the pattern, market volatility, trading timeframe and the trader’s risk-management approach.
Common Chart Pattern Mistakes and False Breakouts
Chart patterns can fail, and price may temporarily move beyond an important level before reversing direction. This is commonly referred to as a false breakout.
Some common mistakes traders should be aware of:
- Entering before the pattern is properly formed
- Assuming every pattern will produce the expected move
- Ignoring the broader market trend
- Trading a breakout without waiting for confirmation
- Ignoring nearby support and resistance
- Using very tight stop losses during volatile conditions
- Relying only on a chart pattern without considering other market information
Chart patterns should therefore be treated as analytical tools rather than guaranteed predictions of future price movement.
Key Takeaways
- Chart patterns help traders study recurring price structures and market behaviour.
- Head and Shoulders is commonly studied as a potential reversal pattern.
- Ascending, descending and symmetrical triangles help traders identify periods of price consolidation.
- Bull flags, bear flags and pennants are commonly associated with potential trend continuation.
- A breakout or breakdown can help confirm a chart pattern.
- False breakouts can occur, so chart patterns should not be treated as guaranteed signals.
- Risk management remains important regardless of the pattern being traded.
Frequently Asked Questions About Chart Patterns
What are chart patterns in trading?
Chart patterns are recognizable formations created by price movements on a trading chart. Traders study these formations to identify potential trend continuation, reversal, breakout and consolidation scenarios.
Which chart patterns are commonly used by traders?
Commonly studied chart patterns include Head and Shoulders, inverse Head and Shoulders, ascending triangles, descending triangles, symmetrical triangles, bull flags, bear flags and pennants.
Are chart patterns reliable?
Chart patterns can provide useful information about price behaviour, but they are not guaranteed trading signals. Traders may use breakouts, volume, support and resistance, technical indicators and risk management to evaluate a pattern.
What is the difference between reversal and continuation chart patterns?
Reversal patterns are associated with the possibility that an existing trend may change direction. Continuation patterns generally develop during a temporary consolidation where traders watch for the previous trend to resume.
How do you confirm a chart pattern breakout?
Traders may look for price moving beyond an important support, resistance, neckline or trendline level. Candle closes, trading volume and other technical factors may also be considered for additional confirmation.
Which chart patterns are useful for intraday trading?
Intraday traders may monitor patterns such as triangles, flags, pennants and Head and Shoulders formations. Their usefulness depends on market conditions, timeframe, liquidity and whether the pattern receives adequate confirmation.