

The History of Candlestick Patterns
Candlestick charting started in 18th-century Japan. A rice trader named Munehisa Homma created the first candlestick charts. Later, Steve Nison brought this method to the Western world. Today, candlestick patterns are a key part of technical analysis. They help traders see market mood and predict where prices might go next. To learn more, explore different candlestick patterns and how they work.
The "rice trading" origins of candlestick patterns highlight the long history of technical analysis in financial markets.
The Anatomy of a Candlestick

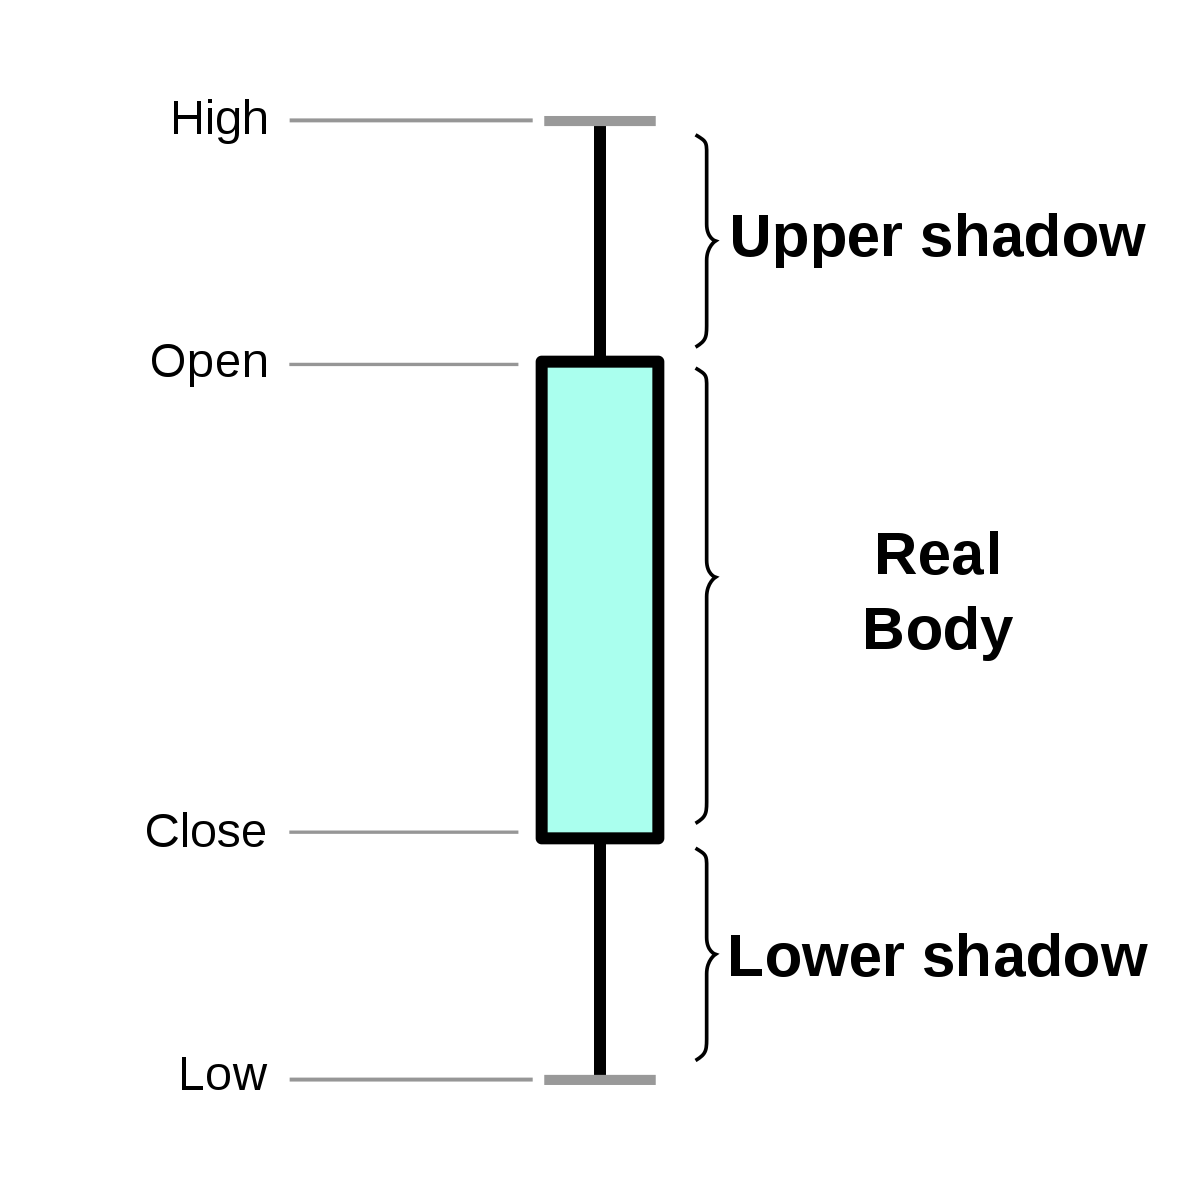
Each candlestick shows four things for a time period: the open, close, high, and low prices. The thick part (called the real body) shows the range between open and close. A filled body means the close was lower than the open. A hollow body means the close was higher than the open. The thin lines above and below are called shadows or wicks. They mark the highest and lowest prices.
In a daily chart, a candlestick with a long lower shadow shows that buyers stepped in to push prices back up after a drop.
Single Candlestick Patterns
The Hammer and Inverted Hammer

A Hammer has a small body near the top with a long lower shadow. It often appears during a downtrend and can signal a possible move upward. An Inverted Hammer also has a small body, but with a long upper shadow. It suggests buyers may be gaining control.
A Hammer pattern in a downtrend on the NIFTY 50 index could indicate a potential shift to an uptrend.
The Doji
A Doji looks like a cross. It forms when the open and close prices are close to equal. This pattern shows that buyers and sellers are evenly matched. It can mean a trend change might be coming, but you should wait for more proof before you act.
A Doji after a long uptrend in the Reliance Industries stock might signal that the bulls are losing control and a reversal could be near.
Multiple Candlestick Patterns
The Engulfing Pattern

A Bullish Engulfing pattern happens when a small red candle is followed by a larger green candle that covers it fully. This often appears in a downtrend and can signal a move upward. A Bearish Engulfing is the opposite. A large red candle covers a smaller green candle, which can signal a move downward.
A Bullish Engulfing pattern on the HDFC Bank chart suggests that buyers have overtaken sellers, which may lead to a price increase.
The Morning Star and Evening Star
A Morning Star is a three-candle pattern that signals a possible move up. It starts with a long red candle, then a small candle, and ends with a long green candle. An Evening Star is the opposite. It starts with a long green candle, a small candle, and then a long red candle. This pattern can signal a move down.
An Evening Star formation on the TATA Motors stock chart could be a warning for traders to consider taking profits.
Advanced Candlestick Concepts
Fibonacci Retracement with Candlestick Patterns

Fibonacci retracement levels work well with candlestick patterns. Traders watch for reversal patterns at key levels like 38.2%, 50%, and 61.8%. When a pattern appears at one of these levels, it may be a stronger signal for a trade entry.
A Hammer pattern that forms right at the 61.8% Fibonacci retracement level of the previous uptrend in Infosys stock can provide a high-probability entry point for traders.
Volume Confirmation

Volume helps confirm candlestick patterns. A Bullish Engulfing pattern with high volume is more reliable. High volume means strong buying interest. Low volume means the signal may be weak and less trustworthy.
A Doji pattern with above-average volume on the SBI stock chart may suggest a stronger signal for a potential price reversal.
Blending Candlesticks for Clearer Signals
Some traders blend two or more candlesticks into one. This gives a clearer view of market mood. For example, blending two Dojis can form a Bullish Harami, which hints at a possible move upward.
Blending candlesticks can be useful when trading stocks like ICICI Bank, where daily moves are volatile and single candlesticks may not give a clear signal.
The Psychology Behind Candlestick Patterns
Each candlestick pattern tells a story about the battle between buyers and sellers. A Long-Legged Doji shows a tough fight where neither side wins. This can mean more volatility is ahead.
A Long-Legged Doji during earnings season for IT companies could signal uncertainty about the sector's performance.
Learning candlestick patterns can help you trade with more confidence. Use them along with other tools like support and resistance levels or volume analysis to get the full picture. No single pattern should be used alone to make a trade. Trading in the Indian market can become clearer when you understand what the charts are telling you.