The Impact Of Support And Resistance Levels On Trading Decisions
How Support and Resistance Levels Create Price Patterns

📈 What Are Support and Resistance Levels?

Support and resistance levels act like barriers in the stock market. They show the price points where a stock often changes direction.
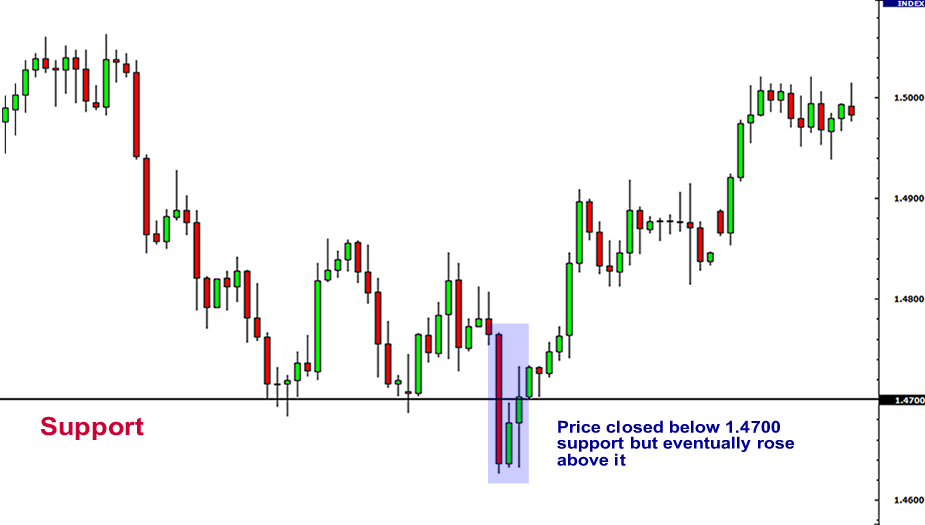
Support is the level where buying is strong enough to stop the price from falling. Think of it as a floor that pushes the price back up.
Resistance is the level where selling is strong enough to stop the price from rising. Think of it as a ceiling that pushes the price back down.
🔍 How to Identify Support and Resistance Levels on Charts

To spot these levels, look for:
Horizontal Lines: Draw these at swing lows for support and swing highs for resistance.
Trend Lines: Draw upward trend lines for support in uptrends. Draw downward trend lines for resistance in downtrends.
Moving Averages: These often act as dynamic support or resistance levels.
Price Patterns: Patterns like ‘head and shoulders’ or ‘double tops’ can show where resistance lies.
Example: On a 6-month chart of a stock, a horizontal line at $50 where the price bounced up several times could mean a strong support level.
📊 The Psychology Behind the Levels

Support and resistance are not just lines on a chart. They show what traders as a group are thinking. A support level means many buyers are ready to buy. A resistance level means many sellers are ready to sell.
💡 How to Trade Using Support and Resistance Levels
Buying Near Support: Many traders buy near support levels. They expect the price to bounce back up.
Selling Near Resistance: Many traders sell near resistance levels. This lets them profit before the price falls.
🔄 Trading Breakouts and Breakdowns
Breakout: When the price moves above a resistance level, it can signal a strong upward trend.
Breakdown: When the price falls below a support level, it can signal a new downward trend.
Example: In 2020, a stock broke through its long-term resistance at $30 and rose to $45. Traders who spotted the breakout early were able to profit.
📝 The Role of Volume

Volume helps confirm whether support and resistance levels are strong. High volume at these levels makes them more reliable.
🚨 False Breakouts and Breakdowns
Not all breakouts or breakdowns are real. Some can be traps. Always wait for confirmation before you trade.
🛠️ Tools for Traders
Technical analysis software and charting tools can help you find these levels more accurately. Common tools include:
Fibonacci Retracement
Pivot Point Calculators
Chart Pattern Recognition Software
🧠 Emotional Discipline and Risk Management
Support and resistance levels are not perfect. Always use stop-loss orders and stay disciplined to manage your risk.
🔄 Why Support and Resistance Levels Often Work
Many traders watch these same levels. When they all act on them, it makes the levels even more powerful.
🔮 Support and Resistance in Bull and Bear Markets
Bull Markets: Resistance levels tend to break more often as prices rise.
Bear Markets: Support levels tend to break more often as prices fall.
📚 Continuous Learning
Keep learning about market trends and practice finding support and resistance levels on charts. The more you practice, the better your trading decisions will become.
Simple step-by-step plan:
Learn what support and resistance levels are:
Example: A support level is a price where a stock stops falling and starts rising. A resistance level is a price where a stock stops rising and starts falling.
Details: Look at past stock charts. Find prices where the stock changed direction many times. Those are your key levels.
Learn how support and resistance affect trading decisions:
Example: If a stock price nears a known support level, traders may buy, expecting the price to bounce back up.
Details: Study examples of traders who used support and resistance levels to make smart trades. Notice how these levels guided their choices.
See how support and resistance show up on stock charts:
Example: Finding a strong resistance level on a chart can help traders set realistic profit targets.
Details: Look at real chart data to see how support and resistance levels have shaped market behavior and trading decisions in the past.
Practice finding support and resistance levels on stock charts:
Example: Use technical analysis tools and common chart pattern formations to spot potential support and resistance levels on a stock chart.
Details: Follow step-by-step examples using real stock charts to learn how to find these levels on your own.

Free Registration for Stock Market Tips ( Advisory Services)
As per the SEBI rules, we will provide our Services only to those clients who have Complete Risk Profile. Fill This Registration Form and
Contact us on
- Whatsapp @ +91 95999 69624
- Call Us @ +91 9650 890 321
for further process.
Risk Profiling is COMPULSORY
The Impact of Support and Resistance Levels on Trading Decisions
Support and resistance levels directly influence trading decisions by providing traders with reference points for entering and exiting positions, setting stop-loss orders, and determining profit targets. Support is a price zone where buying pressure historically overcomes selling pressure, preventing further decline. Resistance is a price zone where selling pressure historically overcomes buying pressure, preventing further rise. When price approaches a known support level, traders often look for buying opportunities, anticipating a bounce. When price approaches a known resistance level, traders often look for selling or shorting opportunities, anticipating a reversal.
What are support and resistance levels in stock trading?
Support and resistance levels are price thresholds on a chart where an asset's price tends to reverse or stall repeatedly. Support acts as a floor that stops price from falling further, while resistance acts as a ceiling that stops price from rising further. These levels form because of concentrated buying and selling activity at those price points.
How do support and resistance levels guide entry and exit decisions?
Traders use support levels as potential buy zones and resistance levels as potential sell zones. When price tests a support level and holds, traders may enter long positions. When price tests a resistance level and stalls, traders may exit long positions or enter short positions. These levels also help traders place stop-loss orders just below support or just above resistance to manage risk.
What happens during a breakout above resistance or a breakdown below support?
A breakout occurs when price closes decisively above a resistance level, often signaling the start of an upward trend. A breakdown occurs when price closes decisively below a support level, often signaling the start of a downward trend. After a breakout, the former resistance level frequently becomes a new support level. After a breakdown, the former support level frequently becomes a new resistance level.
How do traders confirm whether support and resistance levels are reliable?
Traders confirm reliability by checking how many times price has tested the level, the trading volume at that level, and whether the same level appears across multiple timeframes. Higher volume at a support or resistance level makes it more significant. Levels that have been tested multiple times without breaking are considered stronger than levels tested only once.
- What is the difference between support and resistance?
- Support is a price level where demand is strong enough to prevent further decline, while resistance is a price level where supply is strong enough to prevent further rise.
- Can a support level turn into a resistance level?
- Yes, when a support level is broken, it often becomes a new resistance level. Similarly, when a resistance level is broken, it often becomes a new support level. This concept is known as role reversal or polarity.
- Why do false breakouts occur at support and resistance levels?
- False breakouts happen when price briefly moves beyond a support or resistance level but lacks sufficient volume or momentum to sustain the move, causing price to revert back within the range.
- What tools help traders identify support and resistance levels?
- Common tools include horizontal trendlines drawn at swing highs and lows, moving averages that act as dynamic support and resistance, Fibonacci retracement levels, and pivot point calculations.
- How do support and resistance levels behave differently in bull versus bear markets?
- In bull markets, resistance levels tend to break more frequently as upward momentum overcomes selling pressure. In bear markets, support levels tend to break more frequently as downward momentum overcomes buying pressure.
- What role does trading volume play at support and resistance levels?
- High trading volume at a support or resistance level confirms its significance by showing that many market participants are acting at that price. Low volume at a level suggests the level may be weaker and more prone to breaking.