


Risk management in Intraday Trading
Understand how to manage and minimize the risks associated with day trading.

Types of Risk in Intraday Trading
Identify the various types of risks involved in day trading, such as market risk, liquidity risk, and operational risk..
Develop a risk management plan
Develop a risk management plan that includes setting stop-loss orders, diversifying your portfolio, and using position sizing techniques..
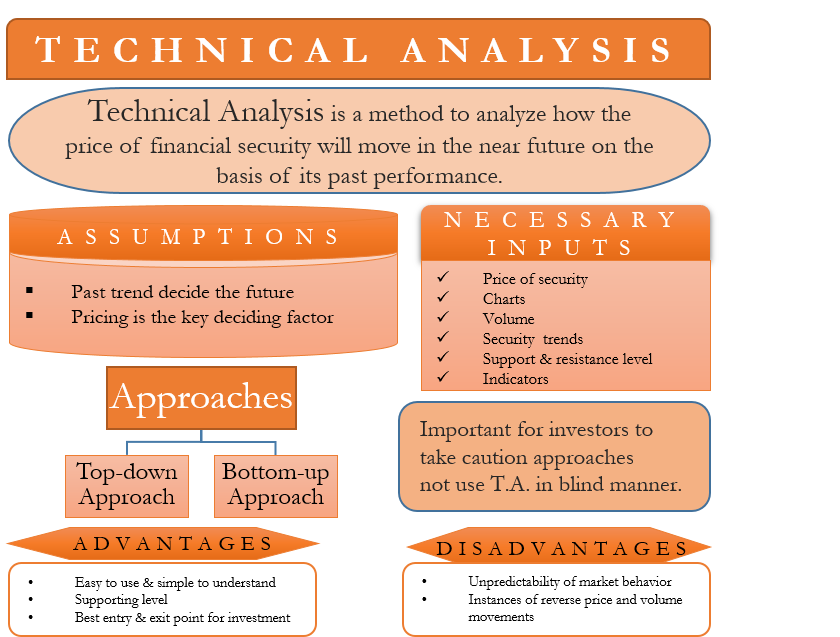
What is Risk Reward Ratio?
Understand the concept of risk-reward ratio and how it impacts your trading decisions and overall profitability..
Market psychology in Day Trading
Study the emotions and behaviors of traders to anticipate market movements

impact of emotions on trading decisions
Two primary emotions are very important for day trading , fear and greed. These emotions can cloud judgment, leading to irrational trading decisions.

Recognize common psychological biases in trading.
Overconfidence Bias, Confirmation Bias , Loss Aversion Bias etc
manage emotions and maintain discipline during trading.
Trading is not just about strategies and numbers; it's a psychological battle.