

What Are Support and Resistance Levels?

Support and resistance levels help traders decide when to buy or sell a stock. Support is the price level where buying is strong enough to stop prices from falling further. Resistance is the price level where selling is strong enough to stop prices from rising higher. These concepts are a key part of any free technical analysis course.
Support acts like a floor that a stock price does not easily fall below. Resistance acts like a ceiling that a stock price does not easily rise above.
Consider the stock of XYZ Ltd. trading on the National Stock Exchange of India (NSE). If the stock has bounced off a price of ₹500 multiple times, this price level would be considered a strong support level.
How to Identify Support and Resistance Levels

To find support and resistance levels, look for places on a stock chart where the price has reversed or paused before. Draw horizontal lines at these levels to see them clearly. Traders often analyze stock charts and patterns to spot these key areas.
Tip: Look for at least two price touches to consider a level as support or resistance. The more touches a level has, the stronger it is.
For ABC Bank shares traded on the Bombay Stock Exchange (BSE), if the price has reversed from ₹250 level several times over the past year, this level would be marked as a significant resistance level.
How Volume Confirms Support and Resistance Levels

Volume helps confirm whether a support or resistance level is real. When many trades happen at a certain price, that level becomes more reliable. High trading volume at a support level means strong demand. High volume at a resistance level means strong supply.
High volume at a support level shows strong buyer interest at that price. High volume at a resistance level shows strong seller interest.
If the stock of PQR Industries shows a high trading volume at a support level of ₹150, it suggests strong buyer interest at that price, reinforcing the support level.
Psychological Support and Resistance Levels

Round numbers often become support and resistance levels. This happens because traders and investors use round numbers as entry or exit points. These are called “psychological” levels.
Psychological levels are strong because people naturally place orders at round numbers.
For the DEF Corp. stock, the price levels of ₹100, ₹200, ₹500, etc., are more likely to become psychological support or resistance levels because traders often set target prices or stop orders at these round figures.
What Is Role Reversal in Support and Resistance?
When a price breaks through a resistance level, that level often becomes new support. The opposite is also true. This is called role reversal and is an important idea in technical analysis.
Role reversal happens because the market remembers past price levels. The feelings traders have about a price level can flip once the price crosses it.
If the stock of GHI Limited breaks above a resistance level of ₹300, that level could become new support as traders may now see it as a good price to buy.
How to Use Trend Lines as Dynamic Support and Resistance
Trend lines are diagonal lines drawn on stock charts. They act as dynamic support and resistance levels. They are called “dynamic” because they change as the chart updates.
Uptrend lines are drawn along the higher lows in an uptrend and act as support. Downtrend lines are drawn along the lower highs in a downtrend and act as resistance.
For JKL Enterprises, an uptrend line drawn connecting the higher lows over six months can serve as a dynamic support level, showing where buyers have stepped in before.
Why Time Frames Matter for Support and Resistance
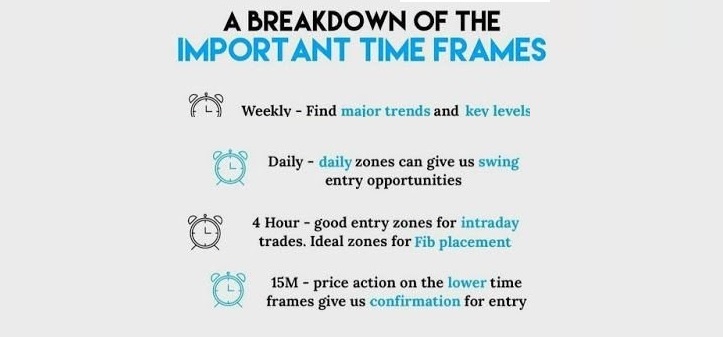
Support and resistance levels can look different depending on the time frame you use. Short-term traders focus on levels from intraday or daily charts. Long-term investors look at weekly or monthly charts.
Different time frames can show different levels. It is a good idea to check multiple time frames to get the full picture.
MNO Corp. may have a clear support level at ₹350 on a 15-minute chart, but a weekly chart might show a more important support level at ₹330.
Using Fibonacci Retracements and Moving Averages

More experienced traders use tools like Fibonacci retracements and moving averages to find support and resistance levels. Fibonacci retracements use key percentages of a price move to predict where support or resistance may form. Moving averages smooth out price data to show trends and act as dynamic support or resistance.
Fibonacci levels are found after a big price move when the market has flattened out. Moving averages change over time as new price data comes in, making them dynamic support or resistance levels.
For OPQ Retail, after a strong uptrend, traders may use Fibonacci retracements to find potential support levels on a pullback, such as the 38.2%, 50%, or 61.8% retracement levels.
Combining Support and Resistance with Other Indicators

For a strong trading strategy, combine support and resistance levels with other tools. This can include momentum indicators like the Relative Strength Index (RSI) or trend tools like the Moving Average Convergence Divergence (MACD).
Combining indicators gives a fuller view of the market and helps confirm whether support and resistance levels are likely to hold.
If RST Utilities stock is nearing a known resistance level and the RSI shows overbought conditions, it may reinforce the chance that the resistance level will hold.
By learning to identify support and resistance levels, Indian stock market traders can make more informed trading decisions.


