

Which Is The Best Indicator For Intraday Trading
Looking for the best indicator for intraday trading? Discover the top indicators to help you make informed decisions and maximize your intraday trading profits. Find out which indicators are trusted by experienced traders and learn how to use them effectively. Boost your intraday trading strategy with the right indicator.
There are lots of indicators in technical analysis and fundamental analysis , here we will cover some important indicators , which you can learn in detail.
Indicators For Intraday Trading
There is no single best indicator for intraday trading that works for every trader. The right choice depends on your style, risk level, and the markets you trade. Many experienced traders combine tools like moving averages, RSI, and Bollinger Bands to spot good entry and exit points. Expert intraday trading tips also play a key role in the stock market. Intraday trading adds liquidity and helps keep prices fair. When traders buy and sell throughout the day, it narrows bid-ask spreads and reduces the impact of large orders on the market.

One key benefit of live share market calls is the chance for high returns. Intraday traders aim to profit from short-term price moves and can make several trades in one day. But intraday trading also comes with real risks. The fast pace can lead to higher volatility and losses if not managed carefully. Traders need discipline, a solid risk management plan, and the ability to handle the pressure of fast-moving markets.
Technical Analysis and Its Role in Intraday Trading
Technical analysis is a method used by traders to forecast future price movements based on historical price data and various technical indicators. It involves analyzing charts, patterns, and indicators to identify trends, support and resistance levels, and potential entry and exit points for trades.
Technical analysis plays a crucial role in intraday trading as it helps traders make informed decisions about when to enter or exit a trade. By studying historical price data and patterns, traders can identify potential opportunities and make predictions about future price movements. Technical analysis also helps traders manage risk by setting stop-loss orders and profit targets based on key support and resistance levels.
It is important to note that technical analysis is different from fundamental analysis, which focuses on analyzing the financial health and performance of a company. While fundamental analysis looks at factors such as earnings, revenue, and market share, technical analysis solely relies on price data and indicators to make trading decisions. Both approaches have their merits, but in intraday trading, technical analysis is often favored due to its ability to provide real-time insights and help traders react quickly to market movements.
Popular Technical Indicators Used in Intraday Trading
Technical indicators are mathematical calculations based on historical price data that help traders identify potential entry and exit points for trades. These indicators can be used in conjunction with other forms of technical analysis to confirm trends, predict reversals, and generate trading signals.

There are various types of technical indicators used in intraday trading, including trend-following indicators, oscillators, and volatility indicators. Trend-following indicators, such as moving averages, help traders identify the direction of the trend and determine when to enter or exit a trade. Oscillators, such as the Relative Strength Index (RSI), help traders identify overbought or oversold conditions in the market and potential reversal points. Volatility indicators, such as Bollinger Bands, help traders gauge the volatility of a security and identify potential breakouts or breakdowns.
Technical indicators are an important tool in intraday trading as they provide objective data and help traders make more informed decisions. By using moving averages and RSI, traders can reduce the impact of emotions on their trading decisions and rely on data-driven insights instead.
A call option gives the holder the right to buy the underlying asset at a predetermined price, known as the strike price, within a specified time period. On the other hand, a put option gives the holder the right to sell the underlying asset at the strike price within a specified time period.
Options trading works by investors buying or selling options contracts on an exchange. When buying options, investors pay a premium to acquire the right to buy or sell the underlying asset at a later date. If the price of the underlying asset moves in their favor, they can exercise their option and make a profit. If not, they can let the option expire worthless and only lose the premium paid.
Moving Average: A Versatile Indicator for Intraday Trading
Moving averages are one of the most widely used technical indicators in intraday trading. They help traders identify trends, confirm trend reversals, and generate trading signals. A moving average is calculated by taking the average price of a security over a specific period of time.
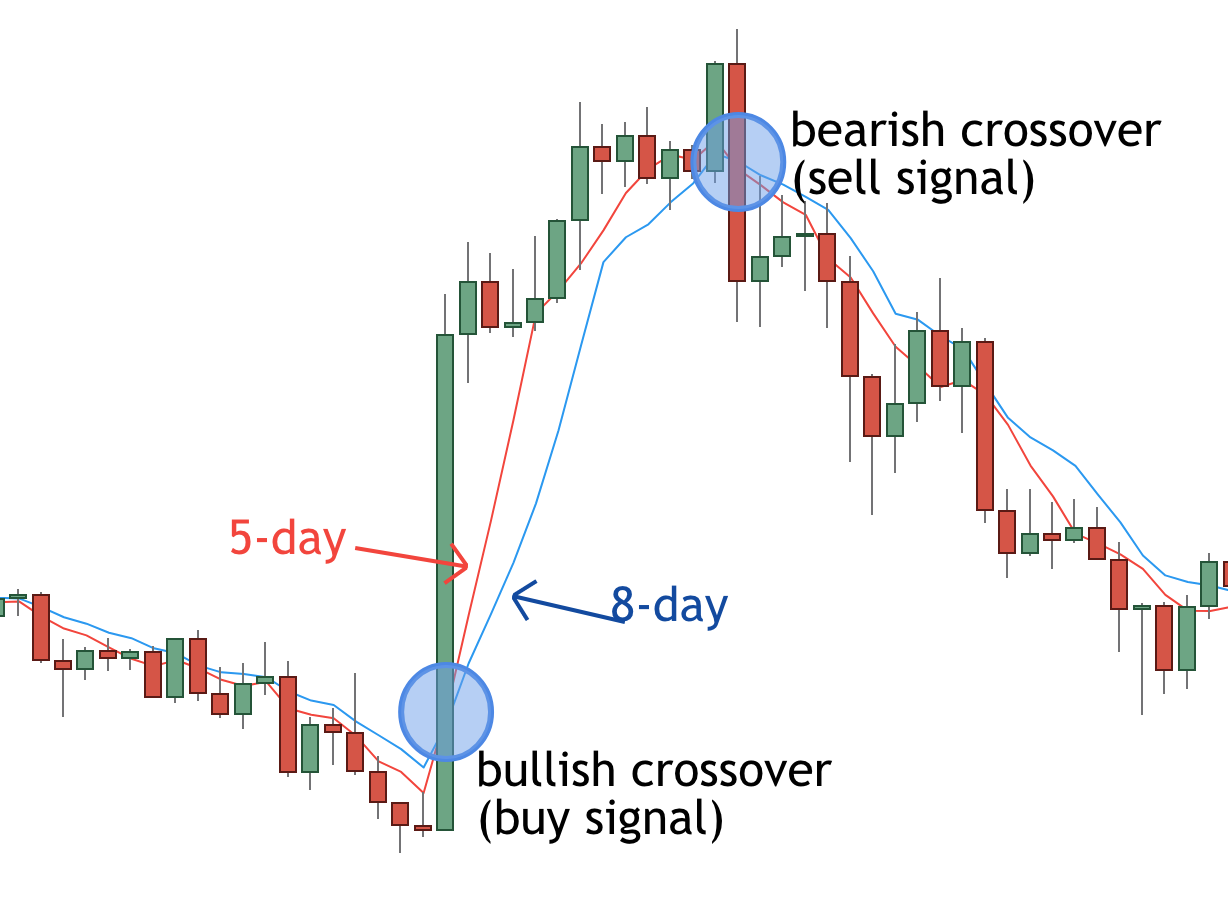
There are different essential market analysis tools, including simple moving averages (SMA) and exponential moving averages (EMA). SMA gives equal weight to all data points in the calculation, while EMA gives more weight to recent data points. The choice between SMA and EMA depends on the trader’s preference and trading strategy.
In intraday trading, moving averages can be used in various ways. One common strategy is to use a combination of short-term and long-term moving averages to identify trend reversals. When the short-term moving average crosses above the long-term moving average, it is considered a bullish signal, indicating that it may be a good time to buy.
Conversely, when the short-term moving average crosses below the long-term moving average, it is considered a bearish signal, indicating that it may be a good time to sell.
Traders can also use moving averages as dynamic support and resistance levels. When the price of a security approaches a moving average, it may act as a support level if the price bounces off it and continues to move higher. Conversely, if the price breaks below a moving average, it may act as a resistance level if the price fails to move higher.

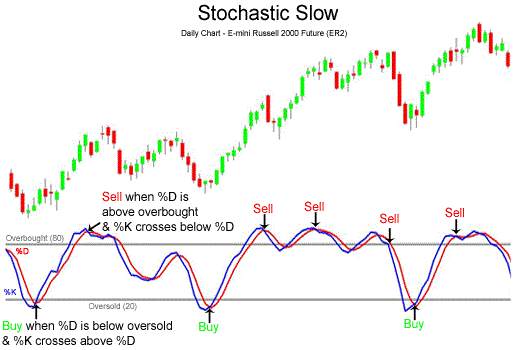
Relative Strength Index (RSI): An Effective Tool for Intraday Trading
The Relative Strength Index (RSI) is an oscillator that measures the speed and change of price movements. It helps traders identify overbought or oversold conditions in the market and potential reversal points. The RSI ranges from 0 to 100, with readings above 70 indicating overbought conditions and readings below 30 indicating oversold conditions.

In technical analysis in intraday trading, the RSI can be used in various ways. One common strategy is to look for divergences between the RSI and the price of a security. If the price is making higher highs, but the RSI is making lower highs, it may indicate that the upward momentum is weakening and a reversal may be imminent. Conversely, if the price is making lower lows, but the RSI is making higher lows, it may indicate that the downward momentum is weakening and a reversal may be imminent.
Traders can also use the RSI to generate trading signals. When the RSI crosses above 30, it is considered a bullish signal, indicating that it may be a good time to buy. Conversely, when the RSI crosses below 70, it is considered a bearish signal, indicating that it may be a good time to sell.
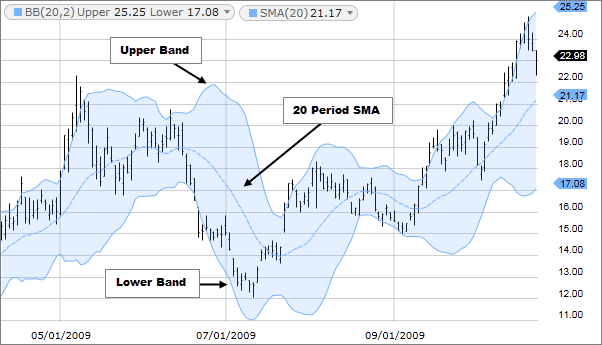
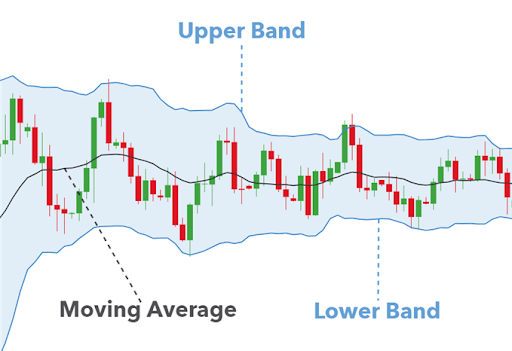
Bollinger Bands: A Powerful Indicator for Intraday Trading
Bollinger Bands are a volatility indicator that consists of a middle band, an upper band, and a lower band. The middle band is usually a simple moving average, while the upper and lower bands are calculated by adding and subtracting a certain number of standard deviations from the middle band.
Bollinger Bands indicator helps traders gauge the volatility of a security and identify potential breakouts or breakdowns. When the price of a security is trading near the upper band, it may indicate that it is overbought and due for a pullback. Conversely, when the price is trading near the lower band, it may indicate that it is oversold and due for a bounce.
Traders can also use Bollinger Bands to identify potential breakouts or breakdowns. When the price breaks above the upper band, it may indicate that there is strong upward momentum and that the price may continue to move higher. Conversely, when the price breaks below the lower band, it may indicate that there is strong downward momentum and that the price may continue to move lower.
MACD: A Reliable Indicator for Intraday Trading
The Moving Average Convergence Divergence (MACD) is a trend-following momentum indicator that consists of two lines - the MACD line and the signal line - as well as a histogram. The MACD line is calculated by subtracting the 26-day exponential moving average (EMA) from the 12-day EMA, while the signal line is a 9-day EMA of the MACD line.
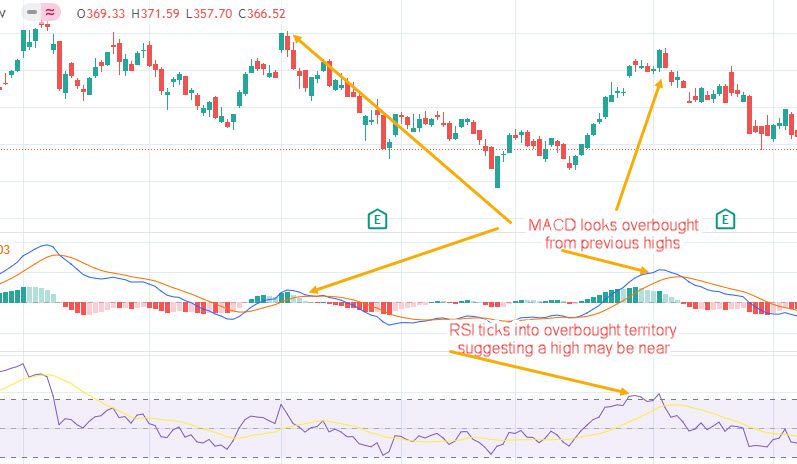
Actionable intraday strategies like the MACD help traders identify potential trend reversals and generate trading signals. When the MACD line crosses above the signal line, it is considered a bullish signal, indicating that it may be a good time to buy. Conversely, when the MACD line crosses below the signal line, it is considered a bearish signal, indicating that it may be a good time to sell.
Traders can also use the MACD histogram to confirm trends and identify potential entry and exit points. When the histogram is positive, it indicates that there is upward momentum in the market. Conversely, when the histogram is negative, it indicates that there is downward momentum in the market.
Fibonacci Retracement: A Unique Indicator
Fibonacci retracement is a technical analysis tool that uses horizontal lines to indicate potential support and resistance levels based on Fibonacci ratios. The most commonly used Fibonacci ratios are 23.6%, 38.2%, 50%, 61.8%, and 78.6%.

Fibonacci retracement helps traders identify potential reversal points and predict price movements. When a security is in an uptrend, traders can use Fibonacci retracement levels to identify potential support levels where the price may bounce off and continue to move higher. Conversely, when a security is in a downtrend, traders can use Fibonacci retracement levels to identify potential resistance levels where the price may bounce off and continue to move lower.
Traders can also use Fibonacci retracement levels to set profit targets and stop-loss orders. By placing these orders at key Fibonacci levels, traders can take advantage of potential price reversals and manage their risk effectively.
Volume: A Crucial Indicator
Volume is a measure of the number of shares or contracts traded in a security during a given period of time. It is an important indicator in intraday trading as it provides insights into the strength and direction of price movements.
High volume often accompanies strong price movements, indicating that there is significant buying or selling pressure in the market. Low volume, on the other hand, often accompanies weak price movements, indicating that there is little interest or participation from traders.
Traders can use volume to confirm trends and identify potential entry and exit points. When the price is moving in the direction of the trend and volume is increasing, it indicates that there is strong momentum in the market. Conversely, when the price is moving against the trend and volume is decreasing, it indicates that there may be a lack of conviction from traders.

Choosing the Best Indicator for Intraday Trading
When it comes to choosing the best indicator for intraday trading, there are several factors to consider. First and foremost, traders should consider their trading style and preferences. Some indicators may be more suitable for short-term scalping strategies, while others may be better suited for longer-term swing trading strategies.
Traders should also consider the reliability and accuracy of the indicator. It is important to choose indicators that have been proven to be effective and have a track record of generating accurate signals. Traders can conduct backtesting and forward testing to evaluate the performance of different indicators and determine which ones work best for their trading strategy.
Lastly, traders should keep in mind that no single indicator can guarantee success in intraday trading. It is important to use indicators in conjunction with other forms of technical analysis and to consider multiple factors when making trading decisions. Traders should also be open to experimenting with different indicators and adjusting their strategies based on market conditions.
FAQs ( Frequently Asked Questions)
What is intraday trading?
Intraday trading refers to buying and selling of stocks or other financial instruments within the same trading day.
What are indicators in intraday trading?
Indicators are mathematical calculations based on the price and/or volume of a security that help traders identify potential trading opportunities.
What are the different types of indicators used in intraday trading?
There are several types of indicators used in intraday trading, including moving averages, relative strength index (RSI), stochastic oscillator, Bollinger Bands, and MACD.
What is the best indicator for intraday trading?
There is no single best indicator for intraday trading as different indicators work better in different market conditions. Traders often use a combination of indicators to make trading decisions.
How do I choose the right indicator for intraday trading?
Traders should choose indicators based on their trading style, market conditions, and personal preferences. It is important to test different indicators and combinations of indicators to find what works best for you.
Can indicators guarantee profits in intraday trading?
No, indicators cannot guarantee profits in intraday trading. They are simply tools that help traders identify potential trading opportunities. Successful trading requires a combination of technical analysis, risk management, and discipline.
Intraday trading is fast-paced and requires quick decisions. Technical analysis and the right indicators give you data to make smarter trades. By learning tools like moving averages, RSI, Bollinger Bands, MACD, Fibonacci retracement, and volume, you can improve your chances of success. But remember, no single indicator is perfect. Good risk management and discipline matter most for long-term results.
If you want to learn more about the best indicator for intraday trading, check out this guide on Top 10 Intraday Trading Rules for Day Traders. It offers helpful tips for both beginners and experienced traders.