

How to Use Technical Indicators to Analyze Stock Price Movements

Technical indicators such as moving averages, RSI, MACD, and Bollinger Bands help you understand stock price trends, momentum, and volatility. Use them to find short term equity trading ideas and make smarter trading decisions.
📈 Moving Averages: How to Spot Stock Price Trends
What Are Moving Averages?
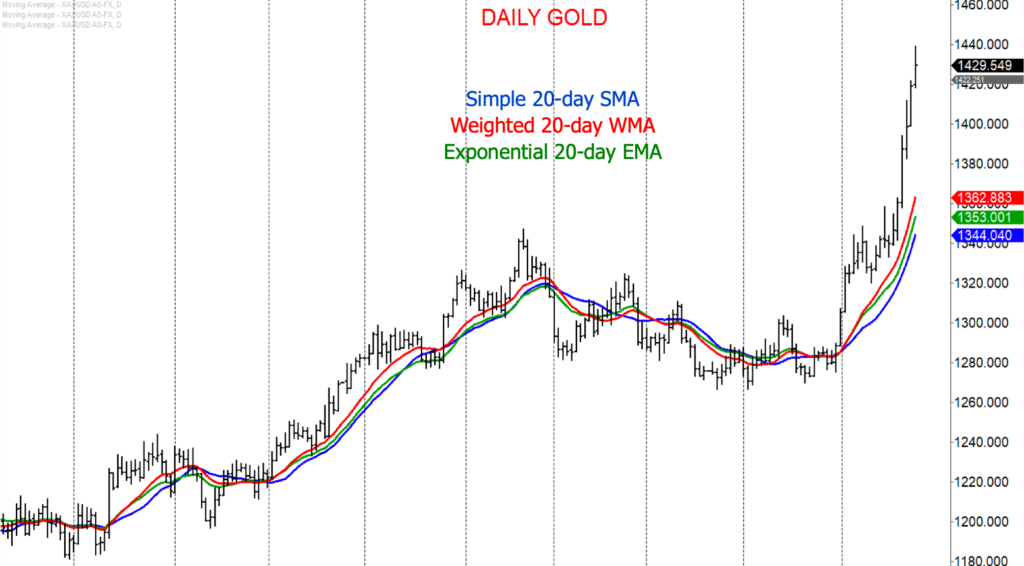
Moving averages smooth out price data to create a single flowing line, which makes it easier to identify the direction of the trend. The two most common types are the Simple Moving Average (SMA) and the Exponential Moving Average (EMA).
How to Use Moving Averages
SMA: Add up the stock’s closing prices over a certain number of periods and divide by that number. It gives equal weight to all prices.
Example: 10-day SMA = (P1 + P2 + ... + P10) / 10\nEMA: Gives more weight to recent prices, reacting more quickly to price changes than the SMA.
Example: EMA_today = (Price_today * (2/(1 + N))) + (EMA_yesterday * (1 - (2/(1 + N))))\n
Real-World Example
If a stock price stays above the 50-day SMA, it often signals a strong uptrend. This can be a sign to hold your position or consider buying more.
📊 RSI (Relative Strength Index): How to Spot Overbought and Oversold Stocks
What Is RSI?
The Relative Strength Index (RSI) is a momentum oscillator that measures the speed and change of price movements. It oscillates between zero and 100.
How to Use RSI
An RSI above 70 is typically considered overbought, while an RSI below 30 is considered oversold.
Example: RSI = 100 - (100 / (1 + RS))\nWhere RS = Average Gain of Up Periods / Average Loss of Down Periods\n
Example in Action
When a stock’s RSI drops below 30, the stock may be oversold. Many traders see this as a buying opportunity before the price rebounds.
📉 MACD: How to Use This Trend-Following Indicator
What Is MACD?
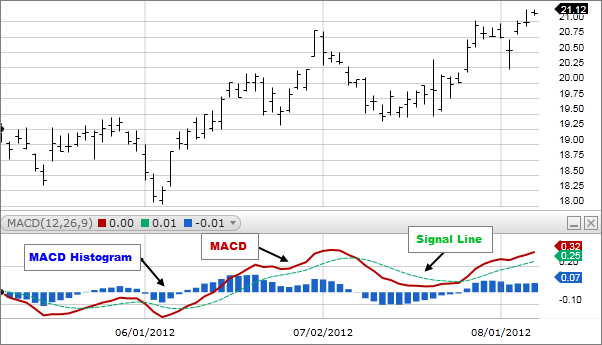
Moving Average Convergence Divergence (MACD) is a trend-following momentum indicator that shows the relationship between two moving averages of a stock’s price.
How to Use MACD
The MACD is calculated by subtracting the 26-period EMA from the 12-period EMA.
Example: MACD = 12-Period EMA - 26-Period EMA\nA bullish crossover occurs when the MACD crosses above its signal line, while a bearish crossover occurs when it crosses below.
Spotting MACD Signals
When the MACD line crosses above the signal line, it is called a bullish crossover. Traders watch for this as a potential buy signal.
📏 Bollinger Bands: How to Measure Stock Volatility
What Are Bollinger Bands?

Bollinger Bands are a volatility indicator that consists of a middle band being an SMA, and two standard deviation lines (bands) above and below it.
How to Use Bollinger Bands
The closer the prices move to the upper band, the more overbought the market, and the closer the prices move to the lower band, the more oversold the market.
Example: Middle Band = 20-day SMA\n Upper Band = 20-day SMA + (20-day standard deviation of price x 2)\n Lower Band = 20-day SMA - (20-day standard deviation of price x 2)\n
How to Spot Trading Opportunities
When a stock price touches the lower Bollinger Band and starts moving up, it can signal a good time to buy. Traders watch for this pattern to find entry points.
Putting Technical Indicators to Work

By learning and using these technical indicators, you can make more informed trading decisions. Remember, no single indicator is perfect. Always combine them with other tools and your own analysis for the best results.
Short step-by-step plan:
Moving Averages:
- Example: Start with simple moving average (SMA) and exponential moving average (EMA) to understand how they smooth out price data over a specified period.
- Details: Calculate the SMA and EMA for a stock over a specific time frame, such as 10 days, and observe how they fluctuate in response to price movements.
Relative Strength Index (RSI):
- Example: Choose a stock and analyze its RSI values over a period of time to identify overbought and oversold conditions.
- Details: Use a stock’s historical price data to calculate RSI and observe how it indicates potential trend reversals.
Master Moving Average Convergence Divergence (MACD):
- Example: Apply MACD to a stock chart and identify the crossover between its signal line and MACD line.
- Details: Analyze how the crossover signals potential changes in the stock’s trend and momentum.
Use Bollinger Bands:
- Example: Select a stock and observe how its price movements interact with the upper and lower Bollinger Bands.
- Details: Understand how the width of the bands indicates volatility and how price movements outside the bands may signal potential trend reversals.
By following this step-by-step plan and understanding the practical application of these technical indicators, you will be able to practice reading stock chart patterns effectively to make informed trading decisions using technical analysis.