

What are the Put Call Ratio, India VIX, Volatility Index
Market indicators is crucial for successful trading. Market indicators provide valuable insights into market sentiment, trends, and potential price movements. Two important market indicators that traders often use are the Put Call Ratio and India. The Put Call Ratio is a widely used indicator in options trading that measures the ratio of put options to call options traded on a particular security or index. It helps traders gauge market sentiment and predict potential market movements. On the other hand, India VIX is a volatility index specific to the Indian stock market. It measures the expected volatility in the market over the next 30 days and helps traders assess the level of risk and uncertainty.
The Basics of Put Call Ratio
The Put Call Ratio is a measure of market sentiment derived from the trading volume of put options and call options. It is calculated by dividing the total number of outstanding put options by the total number of outstanding call options. The ratio can range from 0 to infinity, with a value above 1 indicating bearish sentiment and a value below 1 indicating bullish sentiment.

The Put Call Ratio (PCR) compares the number of put options to call options traded. It helps you see whether traders feel bullish or bearish about the market. For example, if 100 puts and 200 calls are traded, the PCR is 0.5. This means twice as many calls were traded, pointing to a bullish mood.
The Put Call Ratio is a useful tool for understanding call and put options. When the PCR is high, more traders are buying puts and expect prices to fall. When the PCR is low, more traders are buying calls and expect prices to rise.
The Importance of Put Call Ratio in Trading
The Put Call Ratio can be a valuable tool for traders as it helps them gauge market sentiment and predict potential market movements. By analyzing the ratio, traders can identify periods of extreme bullishness or bearishness in the market, which can be used to make informed trading decisions.
For example, when the Put Call Ratio is high, it signals bearish sentiment. A trader may consider buying put options or shorting the market. Applying option trading strategies based on this signal can work if prices fall as expected. When the PCR is low, it signals bullish sentiment. A trader may consider buying call options or going long.
The Put Call Ratio has given useful signals in the past. During the 2008 financial crisis, the PCR reached very high levels. This showed widespread fear in the market. Traders who watched this signal were able to adjust their positions before prices dropped.

How to Calculate Put Call Ratio
Calculating the Put Call Ratio is a straightforward process. Here is a step-by-step guide:
1. Find the total number of outstanding put options and call options for a stock or index.
2. Divide the total number of puts by the total number of calls.
3. The result is the Put Call Ratio.
Many trading platforms and financial websites offer tools that calculate the PCR for you. They use real-time data on option trading volumes, so you get the numbers quickly.

Interpreting Put Call Ratio: Bullish or Bearish Market?
The interpretation of Put Call Ratio depends on the market conditions and the value of the ratio itself. In general, a high Put Call Ratio indicates bearish sentiment and a potential market decline, while a low Put Call Ratio indicates bullish sentiment and a potential market rally.
If the Put Call Ratio is above 1, more puts are being traded than calls. This means traders feel bearish and expect prices to fall. If the PCR is below 1, more calls are being traded than puts. This means traders feel bullish and expect prices to rise.
Remember, the Put Call Ratio works best when used with other tools. Combine it with technical and fundamental analysis to make better trading decisions.

Introduction to India VIX
India VIX is a volatility index for the Indian stock market. It measures how much volatility traders expect over the next 30 days. This helps you assess risk and uncertainty in the market. The index uses NIFTY option prices for nifty options trading recommendations. Many traders call it the “fear gauge” of the Indian market.
India VIX is based on an options pricing model. It looks at factors like the current market price, strike price, time to expiration, interest rates, and expected dividends. The result shows the expected yearly volatility of the NIFTY index over the next 30 days.

The Role of India VIX in Predicting Market Volatility
India VIX can provide valuable insights into market sentiment and help traders predict potential market movements. When the index is high, it suggests that investors expect higher levels of volatility and uncertainty in the market. Conversely, when the index is low, it indicates that investors expect lower levels of volatility and greater stability.
Traders can use India VIX to plan their strategies. When volatility is high, traders may use strategies that work well with big price swings. This includes buying options or using volatility-based trading strategies. When volatility is low, traders may use strategies that work well in stable markets, such as selling options or using mean-reversion strategies.
There have been real examples of India VIX at work. During the COVID-19 pandemic, India VIX hit record highs as fear and uncertainty grew. Traders who watched this signal were able to use strategies that took advantage of the high volatility.

Interpreting India VIX: High vs Low Volatility
The interpretation of India VIX depends on the level of volatility in the market. A high India VIX indicates that investors expect higher levels of volatility and uncertainty, while a low India VIX suggests that investors expect lower levels of volatility and greater stability.

When India VIX is above its normal range, it suggests traders are fearful. They expect bigger price swings in the market. This can point to possible market drops or sharp moves.
When India VIX is below its normal range, it suggests traders are more relaxed. They expect lower volatility and calmer markets. This can mean stable or range-bound trading.
Remember, India VIX works best when used with other tools. Combine it with technical and fundamental analysis to make better trading decisions.
Volatility Index: Definition and Uses
A volatility index, such as the India VIX, is a measure of expected volatility in the market over a specific period. It provides insights into market sentiment and helps traders assess the level of risk and uncertainty. Volatility indexes are widely used by traders and investors to make informed trading decisions.

The way a volatility index is calculated depends on the index itself. Most volatility indexes use option prices. They look at factors like the current market price, strike price, time to expiration, interest rates, and expected dividends.
Volatility indexes are important in trading. They give you a clear view of market sentiment. By understanding how market volatility influences options trading, you can adjust your strategies and take advantage of price swings.
How to Use Volatility Index in Trading
Volatility indexes can be used in various ways to make informed trading decisions. Here are a few examples:
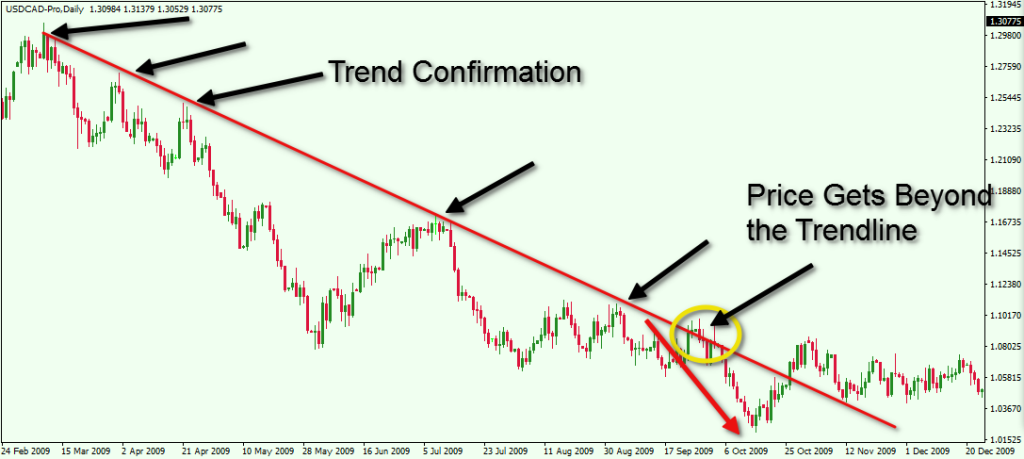
Confirming Trends with Volatility Data
Volatility indexes can help you confirm a trend. If the volatility index is rising while the market is also rising, the uptrend is likely strong and may continue. If the volatility index is falling while the market is falling, the downtrend may be losing steam.

Managing Risk with Volatility Data
Volatility indexes help you measure risk and uncertainty in the market. By watching the volatility index, you can adjust your position sizes and risk management plans. For example, when volatility is high, you may want to reduce your position size or use hedging to protect against losses.
How Volatility Affects Option Pricing
Volatility indexes are used in options pricing models and calculations to find the fair value of an option. By adding expected volatility into the pricing model, traders can see if an option is overpriced or underpriced. This helps them make informed trading decisions.
Limitations of Put Call Ratio and Volatility Index
While Put Call Ratio and volatility indexes are valuable tools for traders, they have certain limitations that should be taken into account.
One limit of these indicators is that they are based on past data. They may not always predict what happens next. Market conditions can change fast, and surprise events can shift market sentiment and volatility.
Another limit is that these tools work best together. Do not use the Put Call Ratio or volatility indexes on their own. Combine them with other technical and fundamental analysis tools. Relying on just one indicator can give false signals and hurt your trading results.
No indicator is perfect. They do not guarantee profitable trades. Professional market advisory services can help you research more deeply, look at many signals, and consider factors like economic data, news, and company fundamentals before you trade.

FAQs ( Frequently Asked Questions)
What is Put Call Ratio?
Put Call Ratio (PCR) is a technical indicator used by traders and investors to gauge the overall sentiment of the market. It is calculated by dividing the total number of put options by the total number of call options traded on a particular day.
What is India VIX?
India VIX is a volatility index that measures the market's expectation of volatility over the next 30 days. It is based on the Nifty 50 index options and is calculated using the Black-Scholes model.
What is Volatility Index?
Volatility Index is a measure of the market's expectation of volatility over a certain period of time. It is calculated using the prices of options on a particular underlying asset, such as a stock index or a commodity.
How is Put Call Ratio used in trading?
Put Call Ratio is used by traders to identify potential market reversals. A high PCR indicates that traders are buying more put options, which suggests a bearish sentiment. Conversely, a low PCR indicates that traders are buying more call options, which suggests a bullish sentiment.
What does India VIX indicate?
India VIX indicates the level of volatility in the Indian stock market. A high India VIX suggests that the market is expecting a significant amount of volatility over the next 30 days, while a low India VIX suggests that the market is expecting relatively low volatility.
How is Volatility Index used in trading?
Volatility Index is used by traders to hedge their positions against potential market volatility. A high volatility index suggests that the market is expecting a significant amount of volatility, which may lead to large price swings. Traders can use options to protect their positions against these price swings.
Learning how to use the Put Call Ratio, India VIX, and volatility indexes can make you a better trader. These tools give you valuable information about market sentiment, trends, and possible price moves. When you add these indicators to your trading plan, you can make more informed decisions.
Remember, these tools work best together. Use them alongside other technical and fundamental analysis tools to get the full picture. Always do your research, manage your risk, and stay up to date with market news.
If you want to learn more about technical analysis for intraday trading, check out this helpful guide on EquityX.in. It covers technical indicators and chart patterns used in the Indian stock market.