

Chart Patterns

Chart patterns help you see the battle between buyers and sellers in the stock market. They show market sentiment and can help you predict where prices may go next. The different chart types available can help you spot these patterns more clearly. Let’s explore some of the most common and useful chart patterns for trading.
Head and Shoulders Pattern

The head and shoulders formation is a reversal pattern that usually forms after an uptrend. It suggests the trend may be about to reverse. The pattern has three peaks. The middle peak (head) is the highest. The two outside peaks (shoulders) are lower and about the same height. A neckline is drawn by connecting the lowest points of the two troughs.
When the price breaks below the neckline, the pattern is complete and a trend reversal is likely. Volume often increases on the breakout, which adds confirmation. To find the target price, measure the height from the top of the head to the neckline. Then subtract that distance from the breakout point.
For instance, if the head is at ₹1500 and the neckline is at ₹1400, the height is ₹100. If the price breaks the neckline at ₹1400, the target would be ₹1300 (₹1400 - ₹100).
Triangle Patterns

Triangle pattern formations are continuation patterns. They can show accumulation or distribution depending on the trend before them. There are three types: ascending, descending, and symmetrical.
Ascending triangles are bullish patterns with a flat top and an upward-sloping bottom. They suggest buyers are more aggressive than sellers as the price makes higher lows.
Descending triangles are bearish patterns with a flat bottom and a downward-sloping top. They suggest sellers are more aggressive as the price makes lower highs.
Symmetrical triangles show a period of consolidation. The price is likely to break out in the direction of the previous trend.
The breakout should come with an increase in volume. The price target is usually found by measuring the base of the triangle and projecting that distance from the breakout point.
If a symmetrical triangle has a base of ₹200 and the breakout occurs at ₹1800, the target price in the case of an upward breakout would be ₹2000 (₹1800 + ₹200).
Flags and Pennants Patterns
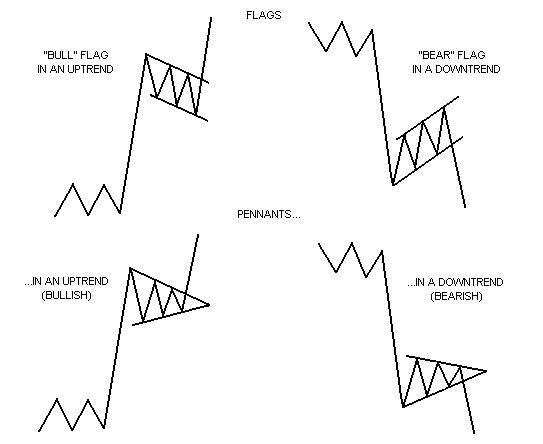
Flag and pennant patterns are short-term continuation patterns. They mark a small pause before the previous move resumes. A flag is a rectangular shape that slopes against the current trend. A pennant looks like a small symmetrical triangle that forms after a sharp move.
The pole is the price surge that comes before the flag or pennant. The continuation is confirmed when the price breaks out in the same direction as the first surge. The target price is found by adding the pole length to the breakout point.
Suppose we have a flag pole that started at ₹1000 and peaked at ₹1200, making the pole ₹200 long. If the price breaks out of the flag at ₹1180, the target price would be ₹1380 (₹1180 + ₹200).
Advanced Chart Pattern Concepts

Knowing basic chart patterns is important for analyzing stock charts effectively. But understanding the finer details can give you an edge. For example, a false breakout happens when the price moves past a pattern but quickly reverses. This can trap traders who acted on the first breakout.
Throwbacks and pullbacks can also happen after a breakout. The price retests the breakout point, which can now act as support or resistance. These retests can be good entry points with a better risk-reward ratio.
In the case of a head and shoulders pattern, if the price breaks below the neckline but then rises to retest it from below, this retest is known as a throwback. If the neckline holds as resistance, it can be a good entry point for a short position.
By mastering these common candlestick formations and understanding their details, Indian stock market traders can improve their technical analysis. Chart patterns are useful tools, but always use them with professional market advisory and good risk management to make informed trading decisions.


