Technical Analysis

How to use Technical Analysis to Make Informed Decisions in Banknifty Options Trading.

How Technical Analysis Helps in Bank Nifty Options Trading

Technical analysis helps you predict where Bank Nifty options prices may move next. By studying past price and volume data, you can make smarter trading decisions in a fast-moving market. For real-time guidance, check our live Bank Nifty options tips.

📊 Chart Types for Bank Nifty Options

Chart Types

Before using technical analysis for Bank Nifty options, learn the different chart types.

  • Line Charts: A simple line of closing prices over a set period.
  • Bar Charts: Shows the open, high, low, and close (OHLC) for each period.
  • Candlestick Charts: Similar to bar charts but use visuals that make patterns easier to spot.

🔍 How to Spot Trends in Bank Nifty

The core of technical analysis is identifying trends in the market.

  • Uptrend: Higher highs and higher lows.
  • Downtrend: Lower highs and lower lows.
  • Sideways/Horizontal Trend: The market is not moving up or down much.

📈 Best Indicators for Bank Nifty Options

Technical indicators are calculations based on price, volume, or open interest. Here are key indicators traders use, including moving averages and RSI indicators:

  • Moving Averages (MA): Smooth out price data to show trend direction.
  • Relative Strength Index (RSI): Measures price speed and change to spot overbought or oversold conditions.
  • Moving Average Convergence Divergence (MACD): Shows the relationship between two moving averages of a price.

🔗 Support and Resistance Levels in Bank Nifty

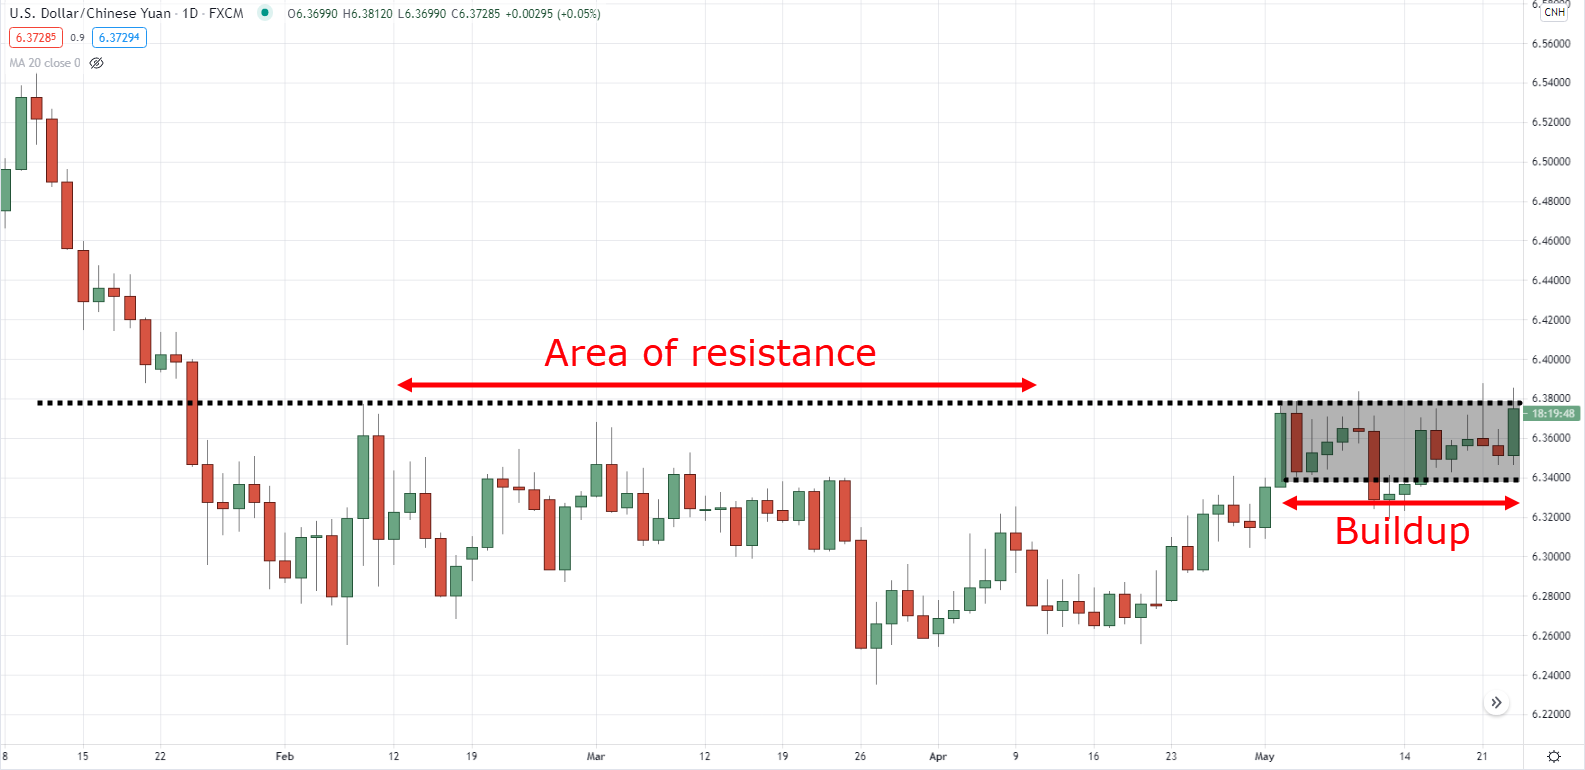
Support and resistance levels act like price barriers.

  • Support: A price level where demand may be strong enough to stop the price from falling further.
  • Resistance: A price level where selling may be strong enough to stop the price from rising further.

📉 Chart Patterns That Signal Market Moves

Chart patterns can show when a trend may continue or reverse.

  • Head and Shoulders: Signals a reversal.
  • Triangles: Can signal continuation or reversal depending on the breakout.
  • Flags and Pennants: Usually signal the current trend will continue.

🔄 How Volume Affects Options Trading

Volume is the number of contracts traded during a given period.

  • High Volume: Shows strong interest and backs up a price move.
  • Low Volume: May show weak interest and a weaker price move.

💡 Combine Tools for Better Trading Signals

Using more than one technical analysis tool can help confirm your trading signals.

For example, if the RSI shows an overbought signal and a bearish head and shoulders pattern appears, the chance of a price drop may be higher.

📝 Backtest Your Bank Nifty Strategy

Backtesting means applying your trading strategy to old market data to see how it would have done.

  • Consistent Results: Suggest the strategy may work in real trading.
  • Inconsistent Results: Mean the strategy needs improvement.

🚀 Risk Management for Options Traders

No technical analysis method is perfect. Always use risk management tools like stop-loss orders to protect your capital.

📚 Keep Learning to Improve Your Trading

Markets change all the time. Keep learning and improving your technical analysis skills to stay ahead.

Mastering technical analysis helps you make better decisions in Bank Nifty options trading. This can lead to more successful trades. Remember to practice and only trade with money you can afford to lose.

Technical Analysis for Bank Nifty Options Trading

Technical analysis for Bank Nifty options trading involves studying historical price data, chart patterns, and technical indicators to forecast future price movements of the Bank Nifty index and make more informed options trading decisions. Traders apply tools such as candlestick charts, support and resistance levels, moving averages, RSI, and MACD to identify entry and exit points, gauge market sentiment, and manage risk in the highly liquid Bank Nifty derivatives market.

What is the best timeframe for Bank Nifty options technical analysis?

The best timeframe depends on your trading style. Intraday traders often use 5-minute or 15-minute charts to capture short-term moves, while swing traders may rely on hourly or daily charts to identify broader trends in the Bank Nifty index.

Which technical indicators work best for Bank Nifty options?

Moving averages (such as the 20-day and 50-day EMA), the Relative Strength Index (RSI), and the MACD are commonly used for Bank Nifty options trading. The RSI helps identify overbought or oversold conditions, while moving averages help confirm trend direction and potential support or resistance levels.

How do you identify support and resistance in Bank Nifty?

Support and resistance levels in Bank Nifty can be identified using horizontal price levels where the index has reversed in the past, trendlines drawn along swing highs and lows, and dynamic levels such as moving averages. Round numbers (e.g., 45,000 or 46,000) also act as psychological support and resistance zones.

Can you use chart patterns for Bank Nifty options trading?

Yes, chart patterns such as head and shoulders, double tops and bottoms, triangles, and flags are widely used in Bank Nifty technical analysis. These patterns help traders anticipate trend reversals or continuations and time their options trades accordingly.

Why is volume important in Bank Nifty options technical analysis?

Volume confirms the strength of a price move in Bank Nifty options. A breakout above resistance on high volume suggests strong conviction and a higher probability of continuation, while a breakout on low volume may indicate a false move and higher risk of reversal.

How do you combine multiple indicators for Bank Nifty options?

Traders combine indicators by using one tool to identify a signal and another to confirm it. For example, if the RSI shows an oversold reading and price is holding above a key moving average support level, the combined signal increases confidence in a bullish options trade setup.

What is the best timeframe for Bank Nifty options technical analysis?
The best timeframe depends on your trading style. Intraday traders often use 5-minute or 15-minute charts to capture short-term moves, while swing traders may rely on hourly or daily charts to identify broader trends in the Bank Nifty index.
Which technical indicators work best for Bank Nifty options?
Moving averages (such as the 20-day and 50-day EMA), the Relative Strength Index (RSI), and the MACD are commonly used for Bank Nifty options trading. The RSI helps identify overbought or oversold conditions, while moving averages help confirm trend direction and potential support or resistance levels.
How do you identify support and resistance in Bank Nifty?
Support and resistance levels in Bank Nifty can be identified using horizontal price levels where the index has reversed in the past, trendlines drawn along swing highs and lows, and dynamic levels such as moving averages. Round numbers (e.g., 45,000 or 46,000) also act as psychological support and resistance zones.
Can you use chart patterns for Bank Nifty options trading?
Yes, chart patterns such as head and shoulders, double tops and bottoms, triangles, and flags are widely used in Bank Nifty technical analysis. These patterns help traders anticipate trend reversals or continuations and time their options trades accordingly.
Why is volume important in Bank Nifty options technical analysis?
Volume confirms the strength of a price move in Bank Nifty options. A breakout above resistance on high volume suggests strong conviction and a higher probability of continuation, while a breakout on low volume may indicate a false move and higher risk of reversal.
How do you combine multiple indicators for Bank Nifty options?
Traders combine indicators by using one tool to identify a signal and another to confirm it. For example, if the RSI shows an oversold reading and price is holding above a key moving average support level, the combined signal increases confidence in a bullish options trade setup.
Scroll to Top