

Moving Averages Can Be Your Trading Compass?

understanding moving averages is essential for traders and investors, guiding them through the choppy waters of market volatility. By smoothing out price data, they help in identifying the direction of the trend and potential turning points.
🌟 Simple Moving Average (SMA)

The Simple Moving Average (SMA) is the most straightforward type of moving average. It’s calculated by taking the arithmetic mean of a given set of prices over a specific number of periods. For example:
SMA = (P1 + P2 + P3 + ... + Pn) / n
Where P1, P2, P3, ... Pn are the prices in each period and n is the number of periods.
Example: If you’re looking at a 10-day SMA, you’d add up the closing prices of the last 10 days and divide by 10.
Real Story: Many traders watched in awe as Apple’s stock respected its 200-day SMA throughout 2019, bouncing off of it multiple times and providing reliable entry points for bullish traders.
🌟 Exponential Moving Average (EMA)

The Exponential Moving Average (EMA) gives more weight to recent prices, which makes it more responsive to new information. The formula for EMA involves a bit more math, incorporating the previous period’s EMA:
EMA = (Current Price - Previous EMA) * (2 / (n + 1)) + Previous EMA
Example: If the previous 10-day EMA was 150 and the current price is 155, the new EMA would be slightly higher, reflecting the recent price increase.
Real Story: In early 2020, when the COVID-19 pandemic hit the markets, the EMA on the S&P 500 index quickly reflected the downturn, signaling traders to adjust their strategies much faster than the SMA.
🌟 Comparing SMA and EMA
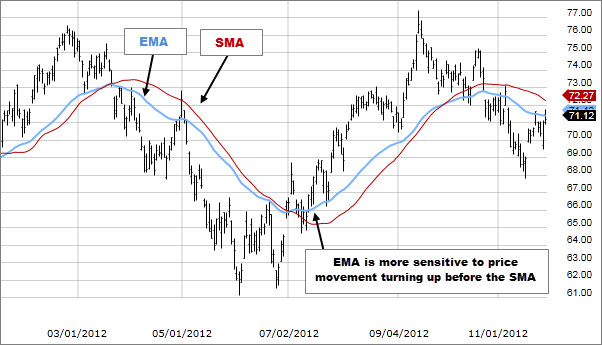
While both SMA and EMA are used to smooth out price data and help identify trends, the key difference is sensitivity. SMA is less sensitive and will show a lag in trend reversals, while EMA is more sensitive and tends to stick closer to the price action, showing reversals more quickly.
Example: A 50-day SMA might show a trend reversal several days after it actually occurs, while a 50-day EMA could show it almost immediately.
Real Story: Consider the cryptocurrency Bitcoin, which is known for its volatility. An EMA could have given traders the signal to exit before a major drop in April 2021, while the SMA lagged, potentially leading to greater losses for those who relied solely on it.
🌟 Using Moving Averages for Entry and Exit Points

analyzing trends with moving averages can also help traders identify potential entry and exit points. When the price crosses above a moving average, it could be seen as a bullish signal, and when it crosses below, a bearish signal.
Example: If a stock price crosses above its 20-day EMA after a period of consolidation, a trader might take this as a sign to buy.
Real Story: In 2017, Amazon’s stock price crossed above its 50-day EMA, which was a signal for many investors to enter. Those who did were rewarded with a significant uptrend that followed.
Utilizing different types of moving averages can greatly enhance your market analysis. Whether you prefer the simplicity of the SMA or the responsiveness of the EMA, both can provide valuable insights into market trends and potential trading opportunities. Remember, no indicator is foolproof, and it’s always wise to use them in conjunction with other tools and your own analysis.
Short step-by-step plan:
Introduction to moving averages:
Explain the concept of moving averages as a tool used to analyze trends in stock prices.
Example: “A simple moving average calculates the average price of a security over a specific number of periods, while an exponential moving average gives more weight to the most recent prices.”
Simple Moving Average (SMA):
Define SMA as the unweighted mean of the previous n data points.
Example: “To calculate the 10-day SMA, add the closing prices of the last 10 days and then divide by 10.”
Exponential Moving Average (EMA):
Explain EMA as a weighted average that gives more weight to the most recent data points.
Example: “To calculate the 10-day EMA, you would use a multiplier of 0.1818 (2/(10+1)) and apply it to the previous day’s EMA and the current day’s price.”
Comparison and application:
Highlight the differences between SMA and EMA in terms of responsiveness to price changes.
Example: “SMA is slower to react to price changes, while EMA is quicker and more sensitive to recent price movements.”
Real-world application:
Provide a real-life example of how moving averages are used to identify potential entry and exit points in trading.
Example: “Traders often use the crossover of short-term and long-term moving averages as a signal for entry or exit in a trade.”